
Quick Answer:
Visual regression testing compares current interface captures against approved baselines and flags meaningful visual differences for review. Broken spacing, a misplaced button, a component that quietly changed state: the things functional tests wave straight through. For teams shipping fast through a CMS and AI-assisted edits, it becomes the gate that keeps a live campaign page looking the way it was signed off to look.
TL;DR
- Visual regression testing captures a baseline image of an approved UI, then compares every new build against it and surfaces the differences for review.
- Two engines do the comparison: pixel matching catches everything and generates noise, while AI-driven diffing surfaces the changes a person would notice.
- Tools split into hosted SaaS platforms with review dashboards and open-source libraries you run inside your own pipeline.
- Percy, Applitools, Chromatic, Argos, Playwright, BackstopJS, and Cypress plugins cover the 2026 field, with pricing that ranges from free to enterprise custom quotes.
- Stabilize dynamic content, pin the render setup, scope snapshots to components, and treat every baseline update as a reviewed code change.
Visual regression testing catches the interface bugs that slip past functional tests. You know the ones: a broken layout or a misaligned button that reaches production and greets your visitors. The right tool matters when front-end stability and a consistent visitor experience carry real weight for the business. This category has matured as more teams recognize what a silent visual break costs them. This piece covers what visual regression testing is, how it works, the strongest tools for 2026, and the practices you can apply right away.
Where Visual Regression Fits in a Release-Control Practice
Visual regression testing is one control inside a bigger job: keeping a public site consistent while it changes every week. Darwin Flux frames that job through four connected areas, and visual regression testing supports each one. Surface is the promise that public pages look the same on every browser, device, and viewport, which is exactly what a visual diff enforces. Connections wires the check into the systems that publish your pages, so a CMS change or an AI-assisted edit passes through the same gate as hand-written code. Clarity fixes the approved baseline and names who owns it, which turns “does this look right” into someone’s call. Momentum keeps review close to the change, so teams can correct visual issues before they create avoidable rework. Read how the four connect in Darwin Flux.
What Visual Regression Testing Is and How It Works
Visual regression testing verifies that the interface still looks correct after a change by comparing current screens against known-good baselines. Regression testing makes sure new code does not break existing behavior. Visual regression testing applies the same idea to the interface and confirms that updates leave the layout and styling intact. Applitools describes it as a way to catch layout, style, or content regressions that functional checks miss.
The Core Process
The workflow follows a clear pattern. You capture screenshots of the application in its current, approved state, and these baseline images represent how the interface should look. After a developer pushes a change, the tool captures fresh screenshots using matching settings for browser, viewport size, and user state. It then compares the baseline against the new capture and marks any difference, often with an overlay marking what moved.
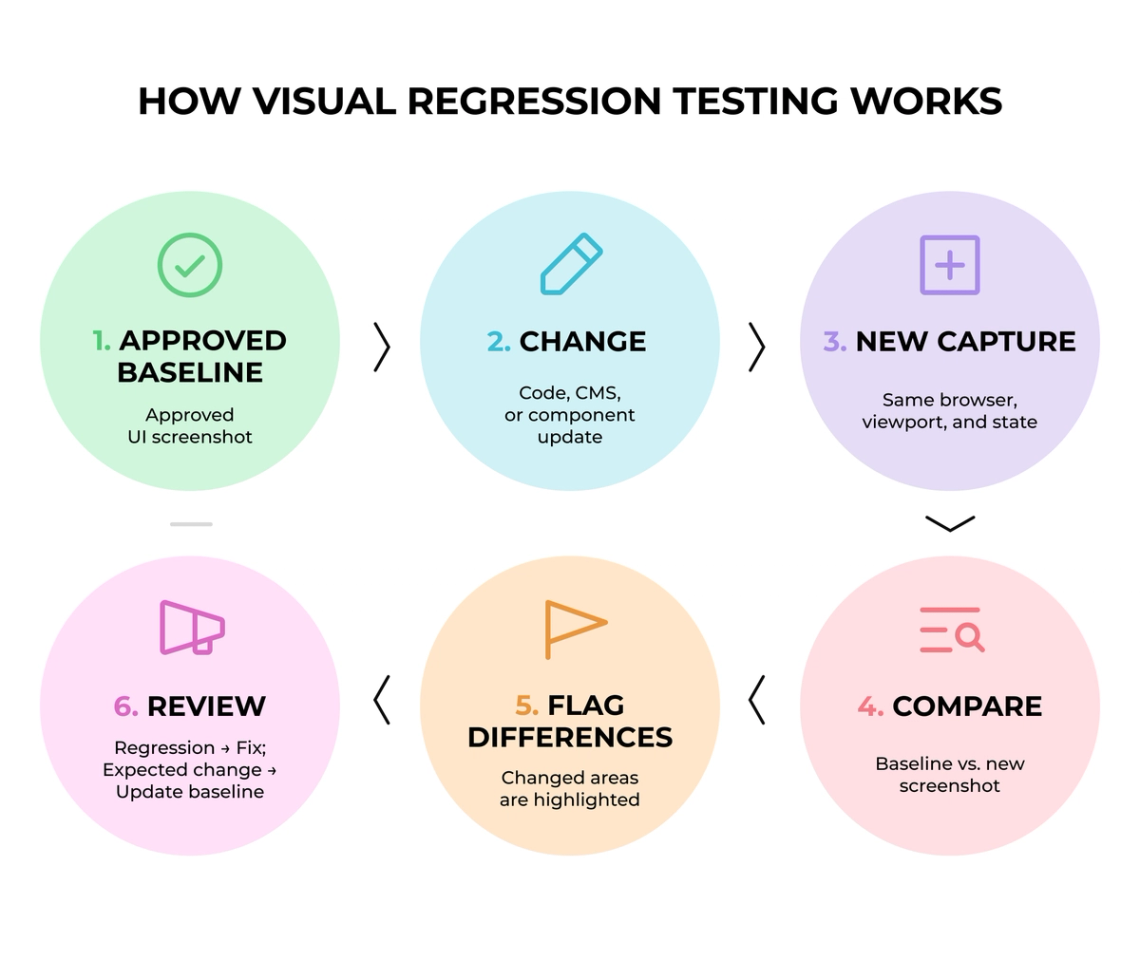
A QA engineer reviews each flagged difference. A true regression, meaning an unintended change, gets logged as a defect. An intentional change triggers a baseline update. The question shifts from “does this still work” to “does this still look right.”
Screenshot Capture and Baseline Management
Baseline images are your visual source of truth, and they only work if they start out right. You capture them once the design and product teams have reviewed and signed off on the current state, because every future comparison measures against that reference. A sloppy baseline bakes the mistake into every run that follows.
“The visual design process is complex. Multiple teams contribute to the look and feel of a page, making it difficult to detect and resolve quality issues.” – Marcus Merrell, VP of Technology Strategy, Sauce Labs
The system keeps a separate baseline for each mix of browser, screen size, and platform. A capture at 1024x768 and one at 1280x1024 never square off against each other; comparing two different resolutions only manufactures noise. Baselines live in version control next to your code, so when a browser ships a new release you make a deliberate choice: rebaseline, or keep comparing against what you have. Committing the images to the repository routes that choice through normal code review, where a second person signs off.
Pixel Comparison and AI-Driven Diffing
Two engines do the comparison, and they behave nothing alike. Pixel-by-pixel comparison checks every pixel and flags whatever differs. It catches everything, which is the problem: anti-aliasing, font smoothing, and a one-pixel render shift all trip it. An off-by-one render after an OS update can block a release, and somebody signs off on that non-issue every single run.
AI-driven comparison reads the screen the way a person does. Applitools shipped its Visual AI approach back in 2013, and it sorts a real visual change from rendering noise, surfacing what a human would catch and dropping the false positives that eat review time. It also confines its attention to regions where a change was not expected. Pixel diffs are cheap and flaky; AI tools cost more and pay it back in quieter runs and less time spent triaging noise.
“Integration tests can miss UI changes that are not visible to the human eye. For example, a button may disappear due to a color change that blends it with the background.” – Chris Kalmar, Co-founder, Lost Pixel
When to Use Visual Regression Testing
Point it at your highest-traffic pages and business-critical flows first, then widen coverage once those baselines settle. Authentication, checkout, dashboards: start where a broken pixel costs you money.
Run visual tests after CSS or styling work, design system updates, and dependency upgrades, and again before a major release. They earn their keep on responsive work that spans desktop, tablet, and mobile. A framework bump, a UI library swap, or a component upgrade can move rendering in ways nobody saw coming, and long text, a missing image, or a new localization string can break a layout with no code change at all. Cross-browser work gains the most here, since the same code renders a little differently in each engine. Wire the tests into your CI/CD pipeline and block the merge when an unapproved change shows up. For marketing sites, the same check is useful after CMS template edits, AI-assisted page changes, shared component updates, and campaign launches where a small visual shift can affect forms, CTAs, pricing blocks, or responsive layouts.
Types of Visual Regression Testing Tools
Tool categories matter more than individual product names when you decide how to implement visual regression testing. The split goes deeper than paid against free. How a tool captures screenshots, where it stores baselines, and who runs the infrastructure shapes your monthly bill and how fast your team reviews diffs.
Cloud-Based SaaS Tools
Cloud SaaS platforms handle the heavy lifting for you. They capture screenshots during your test runs and compare them on hosted infrastructure with built-in diff engines, so setup takes minutes. Percy, Chromatic, and Applitools all follow this model. The defining feature is the review workflow, since these platforms ship dashboards built to approve or reject a visual change. Your QA team gets side-by-side comparisons, overlays, and change indicators with no custom tooling. Percy presents differences through several view modes that keep reviews quick. Chromatic, built by the Storybook maintainers, is designed around Storybook workflows and also supports accessibility and rendering-stability checks.
These tools manage browsers, devices, storage, and scaling for you. Percy uploads the page DOM and re-renders snapshots in its cloud across configured browsers and viewports. Applitools compares screenshots the way a person would, clearing rendering noise and anti-aliasing while flagging the meaningful differences. The trade-off is direct: you hand control to a vendor, your screenshots live on their servers, feature work follows their roadmap, and pricing scales with usage.
Open Source DIY Tools
Open source tools put you in the driver seat. Playwright ships a toHaveScreenshot assertion that needs one line of code and nothing external. BackstopJS gives you scenarios in a backstop.json file, a choice of Puppeteer or Playwright engines, and self-contained HTML diff reports. These tools capture and compare screenshots inside infrastructure you control, with baselines living in your Git repository, and you maintain the browsers, storage, and execution yourself.
The limit shows up in review. Most DIY tools lack a native review interface, so you work with local HTML reports or manual file comparisons in place of a team dashboard. That suits a solo developer and turns painful at team scale.
Pricing Models and Cost
Per-snapshot billing dominates the SaaS space, and a snapshot count climbs fast once you multiply pages by viewports and browsers. Percy no longer publishes a public price and sells on screenshot volume through BrowserStack. Chromatic runs on a free tier and paid plans that start at a published monthly rate for a fixed snapshot allowance. Applitools sells through custom quotes. Open source costs nothing in license and asks for engineering time to set up and maintain. Argos runs a free tier up to a fixed monthly volume, then a flat monthly rate for a large allowance, so your bill holds steady as you add a component or a viewport.
Top Visual Regression Testing Tools for 2026
Several visual regression testing tools define the 2026 field. Each carries its own trade-offs around pricing, AI capability, and integration depth.
1. Percy (BrowserStack)

Percy integrates with existing CI/CD pipelines and captures screenshots across browsers and viewports. A free tier covers a monthly screenshot allowance with unlimited users and cross-browser support. Percy also supports local testing, so a developer confirms a visual change before pushing to the repository. Its intelligent diffing filters dynamic content noise, and the centralized dashboard presents side-by-side comparisons with approval workflows. Paid pricing runs on screenshot volume through BrowserStack in place of a single public rate.
2. Applitools Eyes

Applitools Eyes uses Visual AI to compare interface states and reduce noise from minor rendering differences. Its Ultrafast Grid can render captured pages across multiple browser and device combinations, while integrations cover Playwright, Cypress, Selenium, and Storybook. Applitools also supports visual accessibility checks. Pricing is custom and sales-led.
3. Chromatic

Chromatic centers on Storybook workflows and captures component snapshots with a full baseline history. Tests run in parallel across browsers and integrate with GitHub, GitLab, and CI pipelines. The scope is the trade-off, since it fits best when Storybook is part of your workflow and focuses on components ahead of full-page regression. A free tier is available, and paid plans start at a published monthly rate for a fixed snapshot allowance.
4. Playwright Built-in Visual Comparisons

Playwright ships a toHaveScreenshot() method for visual comparisons through the pixelmatch library. The first run generates the reference screenshots, and later runs compare against them. You configure options such as maxDiffPixels and apply custom stylesheets to filter dynamic elements. Snapshots save as PNG by default in test-specific directories and belong in version control.
5. BackstopJS

BackstopJS is open source and drives scenarios through a JSON file with a Puppeteer or Playwright engine. The tool produces browser-viewable HTML diff reports and runs pure pixel comparison with no AI filtering. It centers on Chrome, ships no collaborative review interface, and asks for manual baseline workflows. It costs nothing and runs noisier than an AI-driven option.
6. Cypress Visual Regression Plugins

Cypress supports visual regression testing through plugins and third-party integrations. The cypress-visual-regression plugin captures screenshots and compares them against stored baselines, with configurable thresholds for handling visual differences. Cypress itself provides screenshot capabilities but does not include built-in image comparison, so a plugin or external integration is required for visual regression testing.
7. Argos

Argos is an open-source visual testing platform that compares screenshots against approved baselines and flags visual changes for review. It captures screenshots in your existing test environment and integrates with Playwright, Cypress, and Storybook. Teams can review and approve visual diffs through its cloud interface, while Argos automatically selects baselines from Git history. A free tier is available, with paid plans for higher screenshot volumes and team collaboration.
Visual Regression Tool Comparison
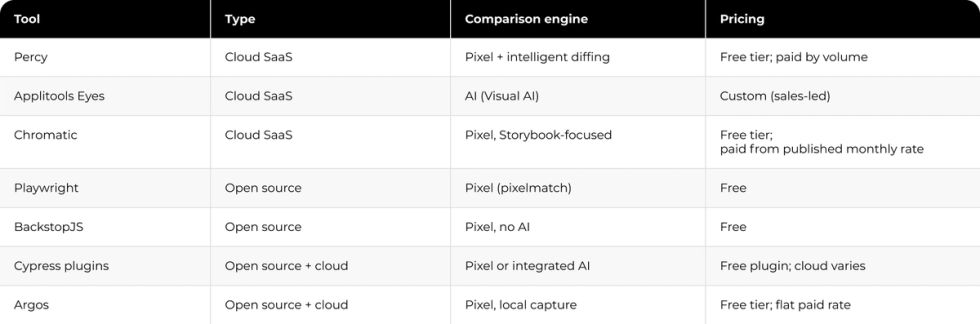
The table below sets the six tools reviewed above, plus Argos, side by side on type, comparison engine, and pricing shape. Argos runs as an open-source platform with local capture in your real test browser and a flat paid rate above a free tier, which makes it a common alternative to the SaaS options for teams that want predictable billing.
Best Practices for Visual Regression Testing
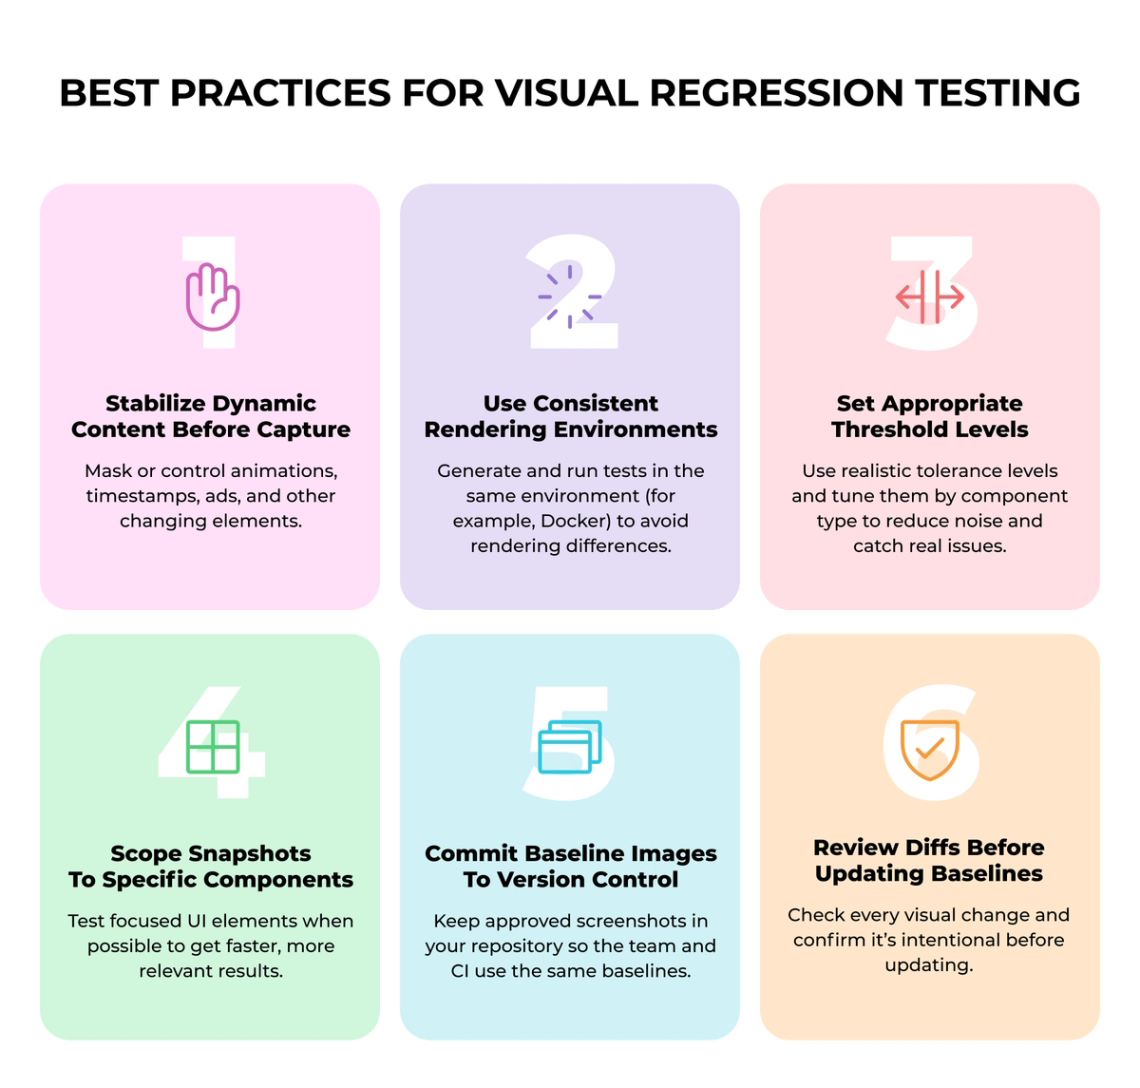
Reliable visual regression testing depends on stable captures, clear baselines, and a review process that separates expected changes from real regressions.
1. Stabilize Dynamic Content Before Capture
Animations, timestamps, ads, and other dynamic data wreck a comparison, since every run captures something slightly different even when nothing broke. Stabilize it before capture: disable or freeze animations and transitions, and control content that changes between runs. Snapshot stabilization freezes motion and normalizes changing content at capture time, so runs line up. Where data is the culprit, mock the API responses or mask the region through your tool’s config.
2. Use Consistent Rendering Environments
Font rendering and anti-aliasing differ between operating systems, so a test fails when you generate a baseline on macOS and compare on Linux in CI. The Playwright Docker image holds rendering steady across environments. Generate baselines inside the same Docker image you use for CI runs.
3. Set Appropriate Threshold Levels
Set thresholds deliberately for the comparison engine and component you are testing. Very strict settings can create noise from minor rendering differences, while loose settings can hide meaningful changes. Start conservatively, review the diffs, and tune the tolerance from observed results.
4. Scope Snapshots to Specific Components
An element screenshot produces a faster and more focused test than a full-page capture. A full checkout-page screenshot picks up noise from unrelated dynamic content. A scope limited to one button means the test fails only when that button changes.
5. Commit Baseline Images to Version Control
Keep approved baselines in version control so developers and CI runs compare against the same reference. Review baseline changes through the same workflow used for other release artifacts.
6. Review Diffs Before Updating Baselines
Treat an update-snapshots command like a code change and review every visual diff before you update. A baseline updated blindly hides a regression inside the new reference.
Setting Up Visual Regression Testing in Your Workflow
Moving from best practices to real implementation means handling four areas where teams struggle.
Integrating With CI/CD Pipelines
Use visual testing as a release gate when an unapproved interface change should stop a deployment. A common workflow runs the visual check after a preview deployment and before broader end-to-end testing, so display issues surface early. Trigger the check on relevant pull requests, retain diff artifacts, and route flagged changes to a human reviewer before approval.
Managing False Positives and Flaky Tests
False positives usually come from unstable rendering conditions or dynamic content. Keep the browser, fonts, viewport, test data, and animation state consistent between the baseline and comparison run. Mask or exclude regions that are expected to change, then tune the tool's diff tolerance only after reviewing real test results.
Cross-Browser and Responsive Testing
Define responsive baselines around the breakpoints that matter to your site instead of treating one viewport as representative. Mobile, tablet, and desktop states often need separate references, and browser coverage should reflect the environments your visitors actually use. Start with the highest-risk combinations, then expand coverage where the additional checks add value.
Component-Level and Page-Level Testing
A card component tested at three viewports produces three screenshots, and ten pages that carry that card produce thirty. Component-level testing catches a styling regression in isolation, and page-level testing catches an integration and layout issue that only appears once the pieces sit together.
Visual Regression Testing for AI-Built Websites
AI-assisted page building changes what visual regression testing has to catch. A marketing team now ships campaign pages fast through a CMS and AI tools, and each fast page can quietly carry a hard-coded color, a one-off form, or a layout that no shared component controls. A CMS edit shifts a pricing block, a shared component update ripples into pages nobody re-checked, and a design token drifts out of sync. Functional tests pass the whole time.
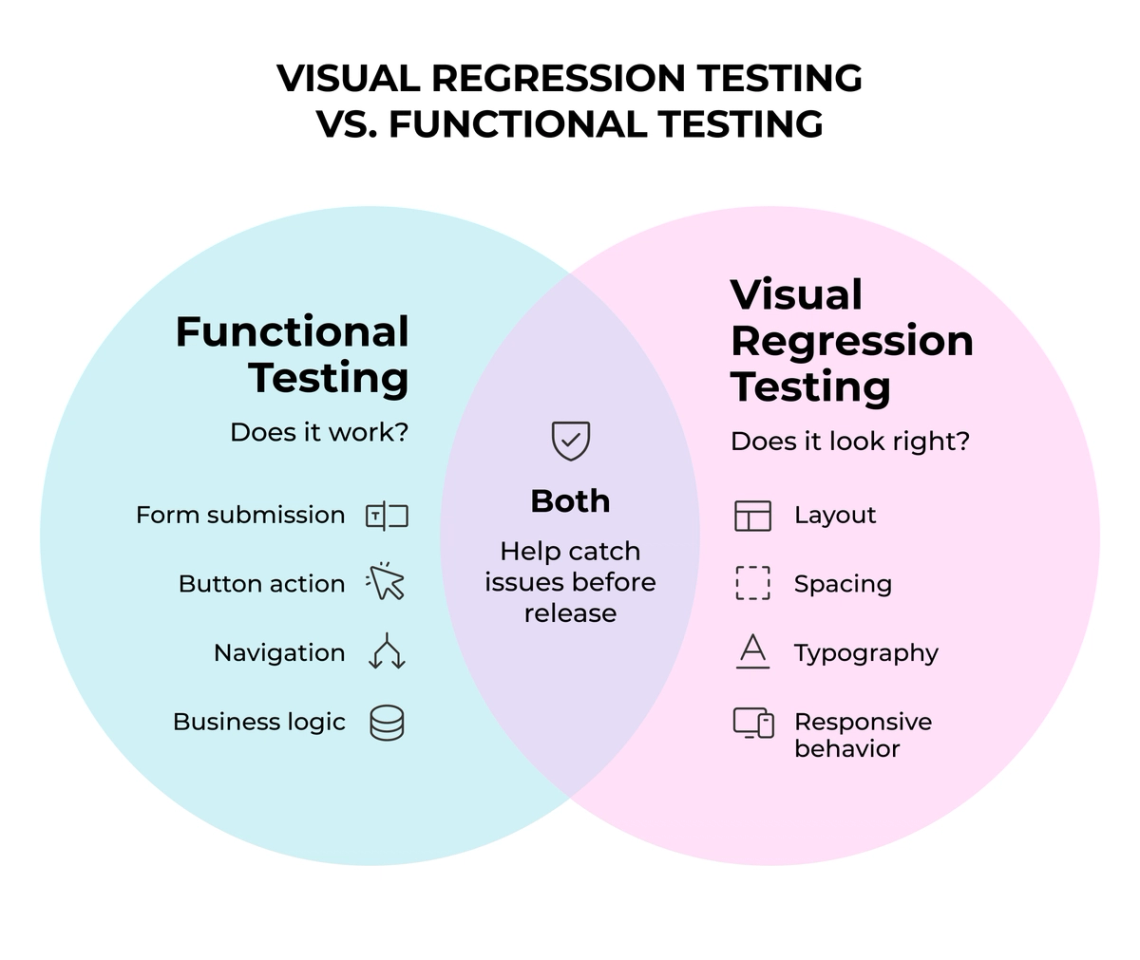
Visual regression testing is the check that catches the pricing tables, CTAs, forms, responsive layouts, and approval-flow states that changed when nobody meant them to.
Visual regression testing catches new visual changes against an approved baseline. It does not map historical design drift across a live site or define who owns the underlying design rules. Fast CMS publishing and AI-assisted page production still need an approved system, clear component ownership, and a review process that keeps new pages aligned over time.
How Darwin Applies This to Marketing Websites
Visual regression testing works best when it is part of a wider release-control process. The baseline needs an owner, CMS changes need a review path, and marketing teams need to know which component changes are intentional before a page goes live.
At Zeplin, Darwin rebuilt the marketing website and blog on Sanity CMS, giving the marketing team direct control over content updates while preserving the approved design standard. Darwin also integrated HubSpot, Mixpanel, and Optimizely so the website could support lead generation, behavioural analytics, and experimentation without fragmenting the experience. Read the Zeplin case study.
That case was not a visual regression testing engagement. It shows the operating context visual testing needs: a managed CMS, reusable design patterns, connected marketing tools, and clear ownership. Screenshot checks then become one release gate inside a system that keeps the public site consistent as the team ships new pages.
If the live website has started to drift from its approved components and design rules, Darwin’s Design System Audit can show where inconsistencies have accumulated and which areas need attention first.
FAQs
Q1. What is visual regression testing?
Visual regression testing shows whether a website still looks as expected after a change. It compares the current version with an approved baseline and flags visual differences for review.
Q2. How does visual regression testing work?
A tool takes a screenshot of the current page and compares it with an approved baseline. If something has moved or changed, the difference is flagged so the team can review it.
Q3. What are the best visual regression testing tools?
Percy, Applitools Eyes, Chromatic, Playwright, BackstopJS, and Cypress plugins are common options. The right choice depends on the existing testing setup, the level of automation needed, and how the team wants to review changes.
Q4. How is visual regression testing different from functional testing?
A page can work correctly and still look broken. Functional tests may confirm that a button works, while a visual test can catch that it moved, disappeared from view, or no longer matches the approved design.
Q5. When should visual regression testing be used?
It is useful when changes can affect how a site looks: CSS updates, CMS edits, component changes, responsive layouts, or design system updates. It can also be added to the release process so visual issues are caught before they reach the live site.