
Quick Answer
Marketing mix modeling (MMM), multi-touch attribution (MTA), and incrementality testing serve different roles in a measurement stack. MMM informs quarterly budget strategy using aggregate data. MTA supports daily campaign optimization at the channel level. Incrementality testing validates whether your ads caused conversions. Mature B2B SaaS teams often benefit from all three, deployed in sequence based on spend level and sales cycle complexity.
TL;DR
- MMM. Top-down statistical model. Less exposed to cookie and user-level tracking loss than MTA. Becomes more useful when offline spend exceeds 20% of budget or annual media spend crosses $3 million.
- MTA. Bottom-up user-level tracking. Best for product-led growth (PLG) SaaS with short cycles under 30 days and high-volume digital conversions.
- Incrementality testing. Controlled experiments that prove causation. Use quarterly to validate what MMM and MTA report.
- Stack all three. MMM for budget allocation, MTA for weekly optimization, incrementality as the tiebreaker when models disagree.
- Start simple. PLG teams start with MTA. Add MMM at $3M+ annual spend. Layer incrementality tests once the first two are stable.
As of 2026, 75% of companies use a multi-touch attribution model to measure marketing performance. At the same time, a 2024 IAB State of Data report found that 63% of publishers saw a 20-40% drop in addressable audience reach due to privacy restrictions and signal loss. That gap makes the choice of measurement method less about preference and more about what your data infrastructure can support.
Mature teams tend to run all three: MMM sets quarterly budget envelopes, MTA drives daily campaign optimization, and incrementality testing confirms which results are real. This article breaks down when to use each method, how they work together, and which approach fits your SaaS business model.
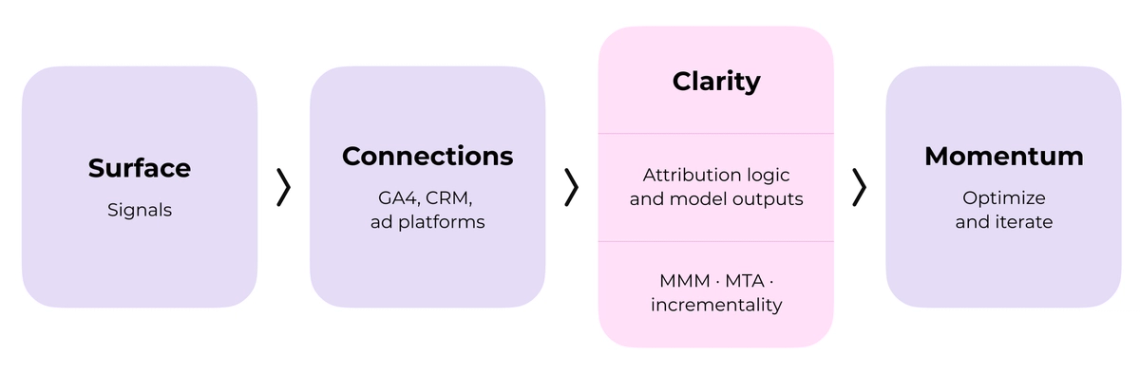
Where this fits in Darwin Flux
Measurement belongs mostly to Clarity, but it depends on Connections. If GA4, CRM, and ad platforms do not agree, MMM, MTA, and incrementality testing will all produce outputs the team will question. The sequence matters: collect the right signals, connect the systems, clarify the reporting logic, then use measurement models to guide optimization.
What Are MMM, MTA, and Incrementality Testing?
Each of the three measurement methods answers a different question. Understanding what each one measures is the foundation for building a stack that serves both your marketing team and your CFO.
How Does Marketing Mix Modeling Work?
Marketing mix modeling (MMM) works as the satellite view of your marketing program. This top-down statistical model uses regression analysis to connect total marketing spend with sales outcomes over time. MMM analyzes patterns over weeks or months, not individual users. It looks at how changes in your TV budget, digital spend, or print campaigns relate to revenue shifts.
The model requires substantial historical data to produce reliable results, two to three years worth. That is because it needs enough data points to separate signal from noise. MMM does not just look at your marketing channels. It factors in seasonality, pricing changes, competitor activity, economic conditions, and even weather patterns. The output tells you which channels drove what percentage of sales and calculates return on investment (ROI) for each one.
MMM is correlative, not causal. The model shows associations between spend and sales but cannot prove your Facebook ads caused those conversions. That is why leading practitioners now supplement MMM with incrementality experiments to verify the correlations. MMM models also take months to build and refresh only quarterly or a few times per year, making them poor tools for up-to-the-minute decisions.
How Does Multi-Touch Attribution Work?
Multi-touch attribution (MTA) operates at the opposite end of the spectrum. It tracks individual users as they move through your marketing funnel and collects data at every digital touchpoint. When someone converts, MTA assigns fractional credit to all the interactions that preceded the purchase.
MTA's strength lies in its granularity. You can see which specific campaigns, creatives, and channels appear most in converting customer journeys. This makes it valuable for day-to-day campaign optimization and budget adjustments within channels you have already verified. MTA models range from simple linear attribution, which gives equal credit to all touchpoints, to sophisticated machine-learning algorithms that weight interactions based on their measured influence.
MTA's reliance on pixels and cookies has become its main weakness. Privacy regulations and platform restrictions mean significant portions of user journey data now go uncollected. A 2024 IAB State of Data report found that 63% of publishers saw a 20-40% drop in addressable audience reach due to signal loss. Walled garden platforms like Facebook and Google do not share cross-platform user movement data. MTA also struggles with B2B SaaS companies that have long sales cycles and multiple stakeholders involved in a single buying decision.
“Attribution and Incrementality are not the same thing. Chalk and cheese. Incrementality identifies the Conversions that would not have occurred without various marketing tactics. Attribution is simply the science of distributing credit for Conversions.” — Avinash Kaushik, Chief Strategy Officer, Croud
What Is Incrementality Testing and When Should You Use It?
Incrementality testing answers the question your CFO cares about: would we have gotten these conversions anyway? It uses controlled experiments that split audiences or geographic regions into test and control groups. One group sees your ads, the other does not. The difference in conversion rates between groups reveals your campaign’s true causal effect.
Incrementality delivers causal proof, not correlative inference. Tests run 14 to 30 days depending on your purchase cycle. The output is incremental return on ad spend (iROAS), showing the actual revenue your advertising caused divided by what you spent. According to eMarketer and TransUnion’s July 2025 data, 52% of brands and agencies now use incrementality testing to measure and optimize campaigns.
The downside: you must withhold advertising from control groups, which means accepting short-term revenue sacrifice. Tests also require geo-targeting capabilities and rule out certain formats like influencer marketing. You can only test a limited number of tactics at once, so incrementality works best as a verification layer, not your primary measurement system.
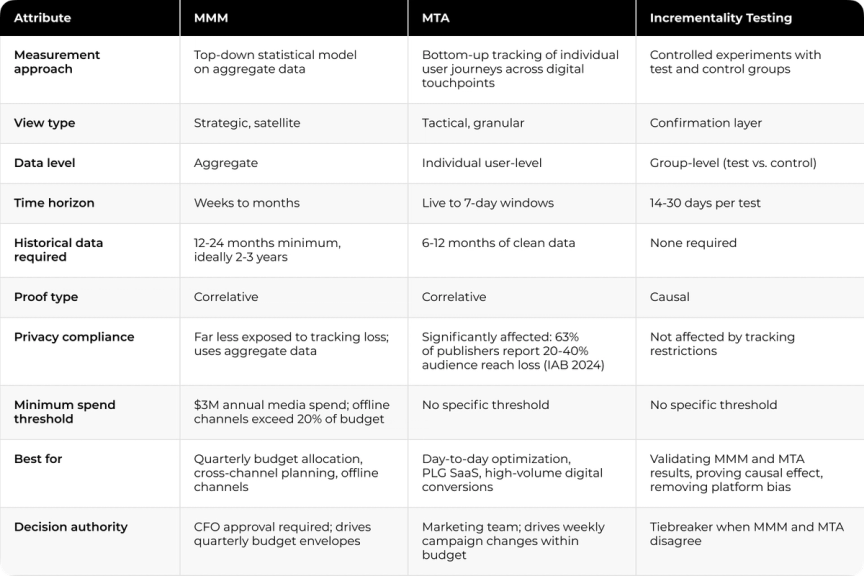
How Do MMM, MTA, and Incrementality Testing Compare?
Each measurement approach comes with trade-offs that matter more or less depending on your business stage and data infrastructure. The table below gives a direct side-by-side view. The sections that follow break down where each method is strongest and where it falls short.
MMM: Cross-Channel Budget Planning
MMM's biggest advantage is that it measures everything using combined data. Because it works with aggregate spend and revenue figures, it is far less exposed to cookie loss and privacy regulations than MTA. Most brands allocate 30 to 60% of their marketing budget to channels that digital attribution cannot measure. Without MMM, those investments are harder to evaluate in the same measurement layer as digital channels. The model also makes scenario planning possible and lets you simulate budget changes before committing dollars. Modern platforms can run thousands of simulations in minutes and answer questions like “what happens if we cut print by 20% and move it to YouTube?”
MMM: Slow Refresh and Data Requirements
You need at least 12 months of data, ideally two to three years, for reliable results. MMM often takes months to set up and updates only a few times per year. This makes it a poor tool for in-the-moment optimization. MMM also requires specialized data science expertise that many marketing teams lack to build and interpret. And the fundamental issue remains: MMM measures correlation, not causation, so incrementality experiments need to verify it.
MTA: Campaign Optimization in the Moment
MTA provides granular, practical feedback for day-to-day optimization at the channel and campaign level. This speed makes it valuable for tactical decisions where reliable user-level data exists. Research shows that marketers who paired analytical MTA models with automated bidding cut cost-of-sales by 18% compared with last-click attribution alone. When evaluating marketing measurement tools, MTA platforms differ significantly in how they handle identity resolution and cross-channel data.
MTA: Privacy and Cross-Device Tracking
Privacy changes have reduced MTA reliability. Apple App Tracking Transparency and browser cookie restrictions mean tracking gaps now skew attribution results. When users switch devices, incomplete UTM tagging and pixel placement issues create blind spots. Advertising platforms optimize based on their own reported conversions and create feedback loops that magnify measurement errors.
“Multi-touch attribution has been plagued by severe data reconciliation issues, walled garden blind spots, the collapse of third-party tracking, challenges of identity and GDPR, and painful on-boarding. Media mix modeling is not granular enough for tactical decision-making and too expensive for mid-market brands.”
Trevor Testwuide, Co-Founder & CEO, Measured
Incrementality Testing: Causal Proof
Incrementality delivers proof of causation, not just correlation. Modern platforms merge geo-based tests and conversion lift studies to verify model predictions within ±10% accuracy. This removes the platform inflation problem where ad platforms take credit for purchases that would have happened anyway.
Incrementality Testing: Business Disruption
Tests require 14 to 30 days depending on your purchase cycle. You must withhold advertising from control groups and sacrifice potential conversions. You can only review a limited number of tactics at once, which makes continuous testing impractical. Tests also measure immediate lift but do not account for long-term effects like brand awareness or customer lifetime value (LTV).
MMM vs MTA vs Incrementality Testing: Comparison Table
Use this table as a quick reference when deciding which method to apply at each layer of your measurement stack.
Which Measurement Method Fits Your SaaS Business Model?
Your business model determines which method to prioritize first. A product-led growth company with 48-hour conversion cycles faces attribution challenges that differ fundamentally from an enterprise SaaS business closing deals over six months. The right starting point depends on sales cycle length, volume, and how much of your spend falls outside digital channels.
What Do PLG SaaS Companies Need From Attribution?
Product-led companies need attribution that moves fast. When self-serve conversion rates hover around 3-5% and sales cycles run under 30 days, you need immediate data on what works. MTA models fit here because the user path is contained and trackable within digital channels you control. Your attribution tool needs to connect product usage signals with marketing touchpoints and track signups through activation to paid conversion.
High signup numbers mean you can validate patterns quickly. Small conversion rate improvements compound by a lot at volume. MMM becomes relevant once you start spending on channels outside digital attribution reach. Most early-stage PLG companies should understand where their customer data lives before choosing an attribution tool.
What Does Enterprise SaaS Attribution Require?
Enterprise deals change the measurement equation. According to HockeyStack Labs research covering 150 B2B SaaS companies, closing a standard B2B SaaS deal requires an average of 266 touchpoints, and enterprise deals above $100K ACV require up to 417. MTA becomes less reliable in these situations because you are not tracking one person’s path. You are tracking a buying committee where different members engage through different channels at different times.
Account-based marketing (ABM) metrics replace lead-based thinking. You measure account engagement scores and buying group participation. Pipeline progression happens at the company level, not individual form fills. MMM becomes useful here because enterprise buying has offline interactions that leave no pixel data: conferences, sales dinners, analyst reports, and direct mail campaigns.
How Should Hybrid SaaS Companies Handle Attribution?
According to OpenView Partners’ 2023 Product Benchmarks Report, 91% of SaaS companies now run hybrid models that combine self-serve and sales-assisted motions. The attribution complexity multiplies because customer acquisition cost (CAC) differs significantly: self-serve CAC runs $100-300 while assisted sales CAC hits $5,000-15,000. Assisted sales converts at 20-30% compared to 3-5% for self-serve.
Your attribution platform needs to handle both at once. It must track self-serve product signups alongside sales-assisted demo bookings in the same framework. Many high-value customers start self-serve and later expand into enterprise contracts. Attribution must connect original product-led acquisition costs with subsequent expansion revenue.
Should You Optimize for MRR or LTV?
Optimize for monthly recurring revenue (MRR) growth and you will weight channels that drive immediate conversions. MTA serves this goal well. When LTV matters more, you need attribution connected to customer lifetime value, not just top-of-funnel metrics. This requires integrating churn data, expansion revenue, and retention cohorts into your measurement framework. MMM helps here because it can model longer-term brand effects that do not show up in last-click attribution but affect customer quality and retention rates.
How Do SaaS CMOs Implement a Measurement Stack?
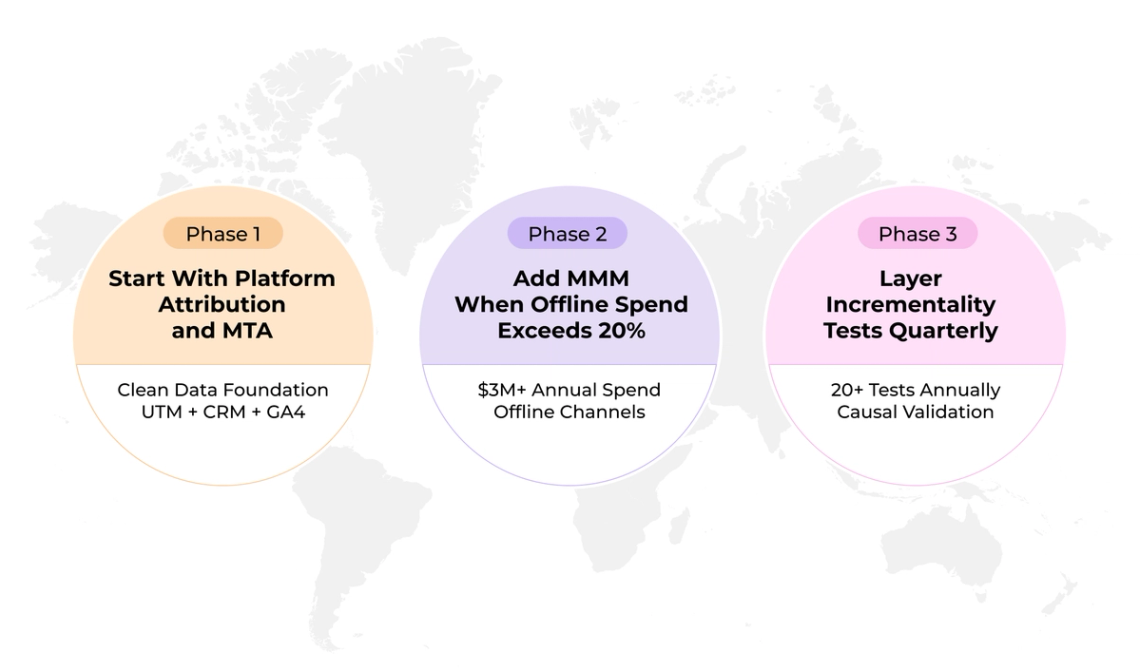
Building a measurement stack is a sequenced process, not a one-time decision. The three phases below reflect the order that makes sense based on data availability, spend level, and team capacity. Each phase builds the data foundation the next one requires.
Phase 1: Start With Platform Attribution and MTA
Most SaaS teams should start here. Set up UTM tracking for all campaigns and implement JavaScript-based event tracking on your site. Connect your CRM with advertising platforms. This foundation captures user-level journey data you will need for MTA models later. Platform attribution from Google Analytics or your marketing automation tool works well initially. You can graduate to an MTA platform that unifies cross-channel behavior once you have 6-12 months of clean data.
Phase 2: Add MMM When Offline Spend Exceeds 20%
MMM makes sense once annual media spend crosses $3 million and you are investing in channels attribution cannot measure. That 20% threshold matters because the investment in building and maintaining an MMM model is not justified below it. You need 12 months of historical data at minimum, 24-36 months preferably, to separate marketing effects from seasonality. Modern MMM platforms now refresh weekly instead of the old quarterly cycle and analyze up to two years of revenue and spend data, making them far more useful than they were three years ago.
Phase 3: Layer Incrementality Tests Quarterly
Brands running mature measurement programs test at least 20 times annually. Some run over 50 tests. Start smaller. Pick your top three channels by spend and schedule quarterly incrementality tests to validate each. Tests need 2-4 weeks of runtime plus an additional 2-4 weeks of observation. Use geographic experiments or conversion lift tests to verify what MMM and MTA are reporting.
What Data Infrastructure Does Each Method Require?
MTA requires JavaScript tracking and UTM parameters with API integrations to ad platforms. MMM needs time-series data, daily or weekly, covering KPIs, media spend, and control variables like seasonality. Server-side tracking solves browser restrictions and creates a single source of truth for attribution and incrementality analysis. A properly structured data warehouse is often the foundation that makes all three methods work from the same numbers.
How Do Leading SaaS Companies Combine All Three Methods?
Running MMM, MTA, and incrementality testing separately produces three different answers. The teams that get the most value from measurement learn to integrate all three outputs into a single decision framework. That integration requires agreed-upon decision rights and a protocol for when the models disagree.
How Do Top Teams Use MMM, MTA, and Incrementality Together?
Nearly half of marketers now use the trifecta: MMM for strategic planning, incrementality testing for causal insights, and MTA for daily optimization. Leaders run MMM monthly, use incrementality results to fine-tune MMM coefficients, and feed attribution data back into both. The loop works because each method validates the others.
What Do You Do When MMM and MTA Disagree?
Facebook MTA reports $3.20 cost per acquisition (CPA). MMM shows $5.80. First, verify both models pull spend from the same source. Second, align time windows since MMM measures 4-8 week lag effects while MTA defaults to 7-day windows. Third, run an incrementality test as the tiebreaker. The gap often represents unattributed brand lift that MTA cannot see.
Who Should Own Each Measurement Output?
MMM drives quarterly budget envelopes and requires CFO approval. MTA drives weekly campaign moves within those envelopes. Disagreement should not paralyze decisions. Document both numbers with the delta labeled clearly, then move forward.
What Does Good Measurement Look Like in Practice?
According to BCG research on marketing measurement, marketers who accurately track what is working can expect a 20-40% improvement in spending efficiency. That range requires a triangulated approach: MMM for top-down budget strategy, incrementality tests as ground truth, and MTA for daily optimization. The gap between companies that run one method and those that integrate all three tends to be a systems problem, not a tactics problem.
How Darwin Builds Measurement Infrastructure for B2B SaaS Teams
Before a SaaS team can choose between MMM, MTA, or incrementality testing, the reporting layer has to be trustworthy. When marketing data lives in disconnected systems, no measurement model produces reliable output regardless of its sophistication.
Cleo shows what has to be fixed before advanced measurement can guide budget decisions. GA4, BigQuery, and Salesforce had to feed one reporting layer before the team could trust performance data. Darwin consolidated those disconnected sources into a unified reporting hub, reduced manual reporting, and improved reporting accuracy. The same logic applies to MMM, MTA, and incrementality testing: each method depends on the quality of the systems underneath it.
Darwin Flux covers the sequence that makes this work: Surface, where forms, pages, and conversion points capture the first signals; Connections, where GA4, CRM, ad platforms, warehouse, and BI tools feed the same reporting layer; Clarity, where attribution logic and model outputs become reliable enough for decisions; and Momentum, where teams use that confidence to optimize budget, testing, and reporting cadence.
For B2B SaaS teams, the goal is to build the operating layer that lets marketing, RevOps, and finance work from the same numbers when budget decisions matter.
FAQs
Q1. What is the main difference between MMM and multi-touch attribution?
MMM takes a top-down view using aggregate data to analyze how spend correlates with sales over weeks or months. MTA tracks individual user journeys across digital touchpoints in real time. MMM is far less exposed to cookie and tracking restrictions. MTA relies on user-level data that privacy regulations increasingly limit.
Q2. When should a SaaS company start using MMM?
When annual media spend crosses $3 million and offline or non-trackable channels exceed 20% of your budget. You also need at least 12 months of historical data, ideally 24-36 months, to produce reliable results.
Q3. Why does incrementality testing matter if I already use attribution models?
Attribution distributes credit. Incrementality testing proves causation. It answers whether those conversions would have happened anyway without your advertising and removes the platform inflation problem where ad platforms claim credit for organic purchases.
Q4. Which method works best for PLG SaaS companies?
MTA fits best for PLG companies with short sales cycles under 30 days and high-volume digital conversions. The user path is contained and trackable. MMM becomes relevant once spend on non-trackable channels grows meaningfully.
Q5. What do you do when MMM and MTA report different numbers?
First, verify both models draw from the same spend source. Second, align time windows: MMM measures 4-8 week lag effects while MTA defaults to 7-day windows. Third, run an incrementality test as the tiebreaker. Document both numbers with the delta labeled and move forward.


