
Quick Answer
The best embedded analytics tool for a SaaS product depends on how you embed, how you isolate tenants and how you want to pay. Luzmo, Embeddable, Qrvey and Reveal fit teams that want native-feeling customer dashboards, and each vendor sets its own pricing model, such as flat-rate licensing at Qrvey and Reveal or a platform fee plus usage at Luzmo. Power BI Embedded, Looker and Tableau fit teams already invested in those ecosystems, and Metabase is the most accessible entry point with published prices.
TL;DR
- Embedded analytics puts dashboards and reports inside your product, so customers see their own data in your interface.
- Tenant isolation is the first test: each customer must see only its own rows, enforced through identity tokens and row-level security.
- SDK and web component embedding feel native, and iframe embedding ships faster with less styling control.
- Pricing models differ more than features: flat-rate, platform fee plus usage, capacity-based and per-user models each change your cost as adoption grows.
- Few vendors publish embedded prices, so plan time for sales quotes and compare three-year totals.
SaaS customers expect to see their own usage, results and trends inside the product they pay for. When those numbers live in a separate BI tool or arrive as CSV exports, the product feels unfinished and support tickets pile up. An embedded analytics tool closes that gap, and the choice you make shapes engineering time, security risk and margins for years.
This guide compares 15 embedded analytics tools for customer-facing SaaS dashboards. It covers how each one embeds, how it isolates tenants, what pricing information is public and where each tool fits. Internal BI tuning, such as speeding up Tableau dashboards for your own team, is a different job and sits outside this list.
Four Questions to Answer Before Analytics Goes Inside Your Product
Answer four product questions first, and the vendor shortlist gets much shorter. Darwin frames this work through Darwin Flux, a model with four pillars that apply directly to embedded analytics.
Surface covers where analytics appears in your product and what each customer sees there. A usage chart on an account page needs different tooling than a full report builder for power users.
Connections covers how data and identity reach the analytics tool. Your app passes tenant context, roles and filters with every request, and the tool reads from your warehouse or database.
Clarity covers shared definitions. Metrics such as active users or revenue need one calculation in one place, so every tenant sees numbers computed the same way.
Momentum covers how fast you can ship dashboards and change them later, and whether costs stay predictable as more customers use them. The sections below map each tool against these four questions.
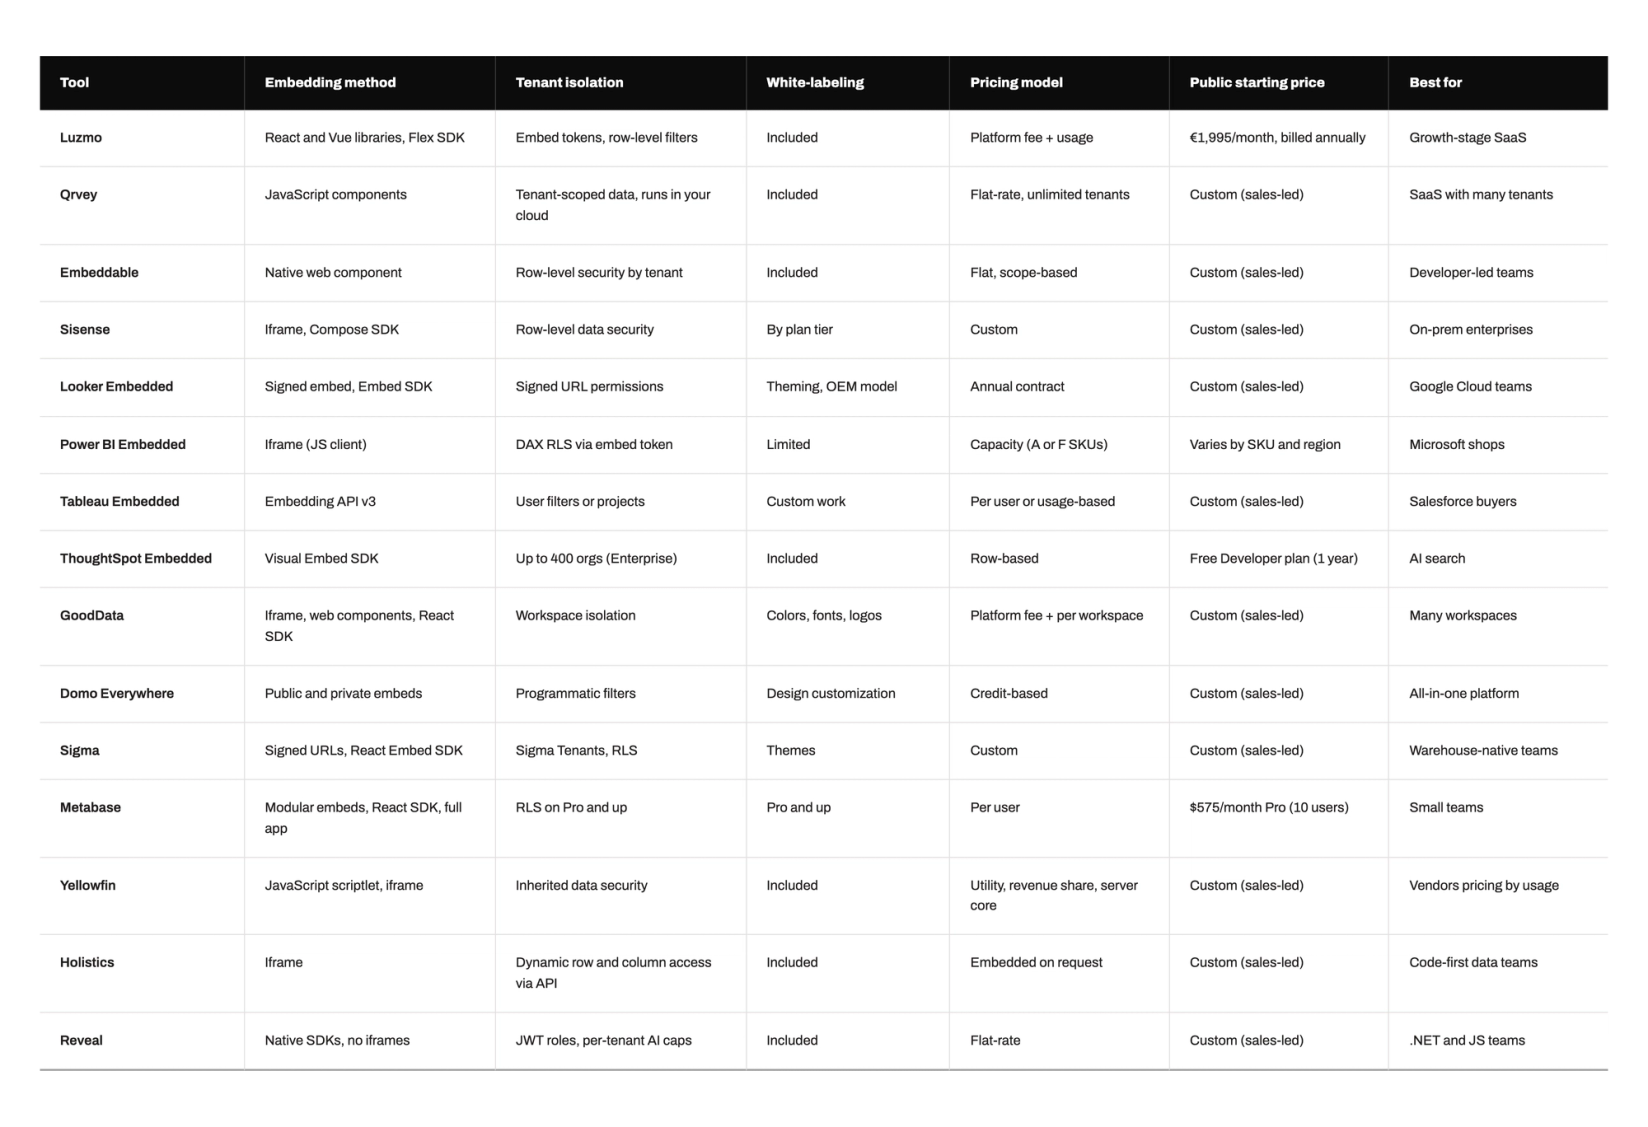
Embedded Analytics Tools Comparison Table
The table summarizes embedding method, tenant isolation, white-labeling and pricing for all 15 tools. Prices reflect vendor pages checked in October 2026.
What Embedded Analytics Means for a SaaS Product
Embedded analytics means your customers explore their own data inside your application, under your brand and your login. The analytics tool runs behind your interface and receives identity and tenant details from your app.
What Makes Analytics Embedded
Analytics counts as embedded when dashboards and reports render inside your product through an SDK, web components, an API or an iframe. Users never log into a separate BI tool. Your application handles authentication and passes tenant context with each request, and the analytics tool uses that identity token to apply the right data filters.
Customer-Facing vs Internal Analytics
Customer-facing analytics serves the people who buy your product, and internal analytics serves your own team. A broken internal dashboard delays a meeting, while customers read a broken embedded dashboard as a product defect.
Load is also harder to predict. Customer-facing analytics must handle concurrency you do not control, serve many external users at once and keep load times low during peaks. Security stakes rise too, because one misconfigured filter can expose one customer's data to another.
The Multi-Tenant Challenge
Multi-tenant analytics serves dashboards from one application to many customer organizations, and each organization must see only its own data. Teams usually pick one of three isolation patterns:
• Shared schema with row-level security, which filters rows by tenant ID and keeps operations simple but demands rigorous testing.
• Schema per tenant, which gives each customer a dedicated schema and stronger isolation.
• Database per tenant, which gives full separation and multiplies infrastructure work.
Each pattern changes which tools fit. Some vendors model tenants as workspaces or orgs, others rely on token-based row filters, and a few deploy into your own cloud account. Buyers now expect analytics to live inside the product itself.
"Enterprises are no longer looking for monolithic BI tools." – Roman Stanek, Founder & CEO, GoodData
Darwin's Digital Product Development team builds the product side of embedded analytics, including authentication, tenant context and in-app dashboard screens.
What to Look for in Embedded Analytics Tools
Look at embedding method, tenant security, pricing model, self-service depth, AI and data connectivity. These six criteria separate tools that look alike on feature lists.
Native SDK vs Iframe Embedding
SDK and web component embedding give you the most control, and iframes give you the fastest start. An iframe can run in an afternoon, with customization limited to the parameters the vendor exposes. Many iframe setups also depend on third-party cookies, and Safari blocks those by default, so a dashboard that loads in Chrome can show a login screen in Safari.
SDKs and web components render charts in your page, share your fonts and CSS variables and expose events your code can subscribe to. Setup takes longer, and the result feels like part of your product.
Row-Level Security and Tenant Isolation
Row-level security filters query results at runtime based on the identity in your embed token. In Power BI Embedded, for example, the embed token carries a username and roles, and DAX rules apply them to every query. Static rules work for a handful of large customers, and dynamic rules scale to thousands of tenants with one role definition.
Test this during your proof of concept. Generate a token for a tenant A user, query tenant B data and confirm the response comes back empty.
Pricing That Scales With Adoption
The pricing model matters as much as the price, because embedded analytics usage grows with your customer base. Per-user pricing raises your bill each time a customer invites a colleague. Usage and credit models track queries or activity, which makes budgets harder to forecast. Flat-rate and platform-fee models separate cost from user count, though some vendors put row-level security or white-labeling in higher tiers.
Self-Service and Customization Depth
Self-service lets your customers build or adjust their own reports inside your product, which cuts custom report requests to your team. Check whether end users can filter and drill down, whether they can save their own views and how far white-labeling goes in fonts, colors, emails and exports.
AI Features Inside the Embedded Experience
Natural-language querying lets customers ask questions in plain English and get a chart back. The useful test is where the AI runs: inside your embedded experience and scoped to each tenant's permissions, or only in the vendor's own interface. Ask how answers are grounded, since tools that query a governed semantic model return more consistent results than tools that generate free-form SQL.
"The future of analytics is agentic, composable, and code-first." – Peter Fedoročko, Field CTO, GoodData
Data Source Connectivity
Your embedded analytics tool needs a reliable path to the data your product already stores. Confirm connectors for your warehouse or database, whether the tool queries live data or caches it and how on-premises sources connect. Warehouse-native tools push every query to your cloud warehouse, so compute costs grow with customer usage.
1. Luzmo
Luzmo is an embedded analytics platform built for product teams that ship customer-facing dashboards.
Key Capabilities
Luzmo provides embed libraries for frameworks such as React and Vue, so full dashboards and individual charts render inside your application. Flex SDK lets developers create charts from code. Multi-tenancy runs on temporary embed authorization tokens, with row-level filtering or connection overrides per tenant, and the UI is fully white-label. End users can create, edit and clone dashboards, and Luzmo IQ adds an embeddable AI assistant for natural-language questions.
Pricing
Luzmo publishes one plan, Embedded Everywhere, starting at €1,995 per month billed annually (listed at $2,495 in USD). The plan includes 500 AI conversations and 100 million Warp synced rows per month. Extra Warp rows cost €0.25 per million, and some contracts scale on monthly active end users.
Best For
Luzmo suits growth-stage SaaS teams that want native-feeling dashboards live in weeks and prefer a platform fee to per-viewer charges.
Trade-offs
Billing is annual only. AI conversations over the included 500 per month bill at a contract rate that Luzmo does not publish.
2. Qrvey
Qrvey is an embedded analytics platform designed for multi-tenant SaaS from the start.
Key Capabilities
Qrvey runs in your own cloud account, with Azure and Google Cloud among the listed options, so customer data stays in your infrastructure. It embeds through JavaScript components with token-based integration and scopes each customer's data to its tenant. End users can configure dashboards and reports and run ad hoc exploration on their own.
Pricing
Qrvey uses flat-rate pricing with unlimited tenants, users and dashboards and no per-seat fees. Qrvey Pro serves teams that bring their own analytics database, and Qrvey Ultra adds a built-in data engine and data preparation tools. Prices come on request, and perpetual licensing is available for both plans.
Best For
Qrvey suits SaaS companies with many tenants that want predictable costs as their user base grows.
Trade-offs
Running Qrvey in your cloud means your engineers own setup and upkeep. Prices come only on request.
3. Embeddable
Embeddable is a developer-first embedded analytics platform that renders charts as components inside your app. It received the 2026 Data Breakthrough Award in the embedded analytics category.
Key Capabilities
Embeddable embeds as a native web component with no iframes, and dashboards can follow your own design system. Its component library is open source and extensible, so developers can customize components or write new ones. Multi-tier caching keeps load times short, row-level security scopes access by tenant and controlled self-serve lets customers explore data, save views and build dashboards within limits you set.
Pricing
Embeddable charges a flat monthly subscription scoped to your project. Pricing does not depend on monthly active users, dashboard views or query volume. Tiers cover startups, scale-ups and enterprises, and quotes come through sales.
Best For
Embeddable suits product teams with front-end engineers who want full control over chart design inside a multi-tenant SaaS product.
Trade-offs
The developer-first model asks more of your engineers and less of business users. Prices are not published, so budgeting starts with a scoping call.
4. Sisense
Sisense is a long-standing BI vendor that now centers its product on embedded and AI analytics.
Key Capabilities
Sisense embeds through iframes or Compose SDK, which offers quickstarts for React, Angular and Vue. Row-level data security filters control which rows each user sees. White-labeling replaces the Sisense logo, colors, fonts, emails and URLs, and Enterprise customers can bring their own LLM.
Pricing
Sisense lists two plans, Self-Serve and Enterprise, and publishes no prices for either. Self-Serve starts with a free trial. Enterprise pricing comes from sales and covers SaaS, dedicated cloud or on-premises deployment.
Best For
Sisense suits enterprises that need on-premises or dedicated deployment and deep white-labeling.
Trade-offs
White-labeling depends on your plan tier, and custom pricing makes early budget estimates difficult.
5. Looker Embedded
Looker Embedded is the Google Cloud option for putting governed Looker dashboards inside your product.
Key Capabilities
Looker centers on LookML, a modeling language that defines metrics, dimensions and business logic once. Signed embedding serves dashboards through an iframe with a signed URL, and the Embed SDK simplifies the integration. Git integration brings version control to model changes. Since April 2026, embedded users can also use Conversational Analytics, Gemini-powered natural-language querying grounded in the LookML model.
Pricing
Google does not publish the Embed edition price, and quotes come from sales on one-year to three-year terms. The edition includes one production instance, 10 Standard Users, 2 Developer Users and up to 500,000 query-based API calls per month.
Best For
Looker suits teams on Google Cloud that want one governed metric model for internal and customer-facing analytics.
Trade-offs
LookML requires dedicated modeling skills. Iframe-based signed embedding gives less styling control than component SDKs.
6. Power BI Embedded
Power BI Embedded is the Microsoft service for software vendors that show Power BI reports to customers who hold no Power BI licenses.
Key Capabilities
In the app-owns-data model, your users do not sign in to Power BI or need a Power BI license. Reports render in an iframe through the Power BI JavaScript client. Row-level security applies the identity you pass with the embed token, and dynamic rules can filter data with DAX functions such as USERNAME().
Pricing
Power BI Embedded bills by capacity, through Azure A SKUs or Microsoft Fabric F SKUs. Rates depend on SKU size and region, so price your setup in the Azure pricing calculator.
Best For
Power BI Embedded suits teams already running Microsoft infrastructure with existing Power BI reports and Azure deployments.
Trade-offs
Iframe rendering limits how closely reports match your UI. Production use requires a paid capacity, and sizing it becomes your team's job as usage grows.
7. Tableau Embedded Analytics
Tableau Embedded Analytics runs Salesforce's Tableau dashboards inside your product.
Key Capabilities
Tableau embeds through the Embedding API v3, which uses web components, and Connected Apps pass a JWT for each user, so your app controls access. Web authoring gives customers self-service report building, and the REST API automates user and content management. Tenant isolation relies on user filters or separate projects per customer, which adds setup work.
Pricing
Tableau publishes per-user prices for internal use, starting at $15 per user per month for Tableau Cloud Standard and $40 for Tableau Next. Embedded deals go through sales. A usage-based licensing option counts Viewer activity as Analytical Impressions in place of per-Viewer licenses.
Best For
Tableau suits SaaS products that sell into Salesforce or Tableau customers who expect familiar dashboards.
Trade-offs
Embedded pricing is not published, and the usage-based option bills Viewer activity, so heavy customer use raises costs. Tenant isolation through user filters or projects is a design your team builds and maintains.
8. ThoughtSpot Embedded
ThoughtSpot Embedded brings search-driven, AI-assisted analytics into your product.
Key Capabilities
The Visual Embed SDK embeds dashboards and Spotter, the ThoughtSpot AI analyst, white-labeled inside your product. Role-based security limits each user to permitted data, with SSO, SAML and token-based authentication. The Enterprise edition supports up to 400 orgs for multi-tenant isolation.
Pricing
The Developer plan is free for one year with up to 10 users and 25 million rows. Enterprise pricing is custom, and ThoughtSpot sizes subscriptions by the total rows made available for querying.
Best For
ThoughtSpot suits products whose customers want search and AI answers more than fixed dashboards.
Trade-offs
Row-based pricing grows with the data you expose. Enterprise pricing is custom, so costs only become clear in a sales quote.
9. GoodData
GoodData is an embedded and AI analytics platform that Gartner named a Visionary in its 2026 Magic Quadrant for Analytics and BI Platforms.
Key Capabilities
GoodData isolates customers through multi-tenant workspace isolation. Embedding works through iframes, web components and a React SDK, and white-labeling customizes color palettes, fonts and logos. Every dashboard, AI Assistant and agent draws on the same governed metric definitions. The AI Assistant gives each user 30 AI queries per day by default, and extra query buckets are available.
Pricing
The Professional plan combines a platform fee with per-workspace pricing and includes unlimited users and data. Enterprise pricing is custom and adds a 99.5% uptime SLA with 24/7 support. Neither plan lists a price, and contracts are annual.
Best For
GoodData suits mid-size and large SaaS companies that serve many customer workspaces with governed metrics.
Trade-offs
Per-workspace costs grow with your tenant count. Contracts are annual, and you cannot downgrade before the current term ends.
10. Domo Everywhere
Domo Everywhere is the Domo embedded analytics offering for sharing dashboards with customers and partners.
Key Capabilities
Domo Everywhere offers public and private embeds. Public embeds serve view-only content to anyone with the URL. Private embeds require authentication and come in user-based, server-based and platform-based variants, and server-based embeds apply filters programmatically so each customer sees only its own data.
Pricing
Domo uses custom, credit-based pricing with unlimited users. Credits are consumed by actions such as storing data, updating tables and running workflows. A 30-day free trial is available.
Best For
Domo Everywhere suits enterprises that want analytics, data integration and customer sharing on one platform.
Trade-offs
Credit consumption depends on how customers use dashboards, which makes cost forecasting harder.
11. Sigma
Sigma is a warehouse-native analytics platform that embeds live warehouse data in customer-facing apps.
Key Capabilities
Sigma embeds full workbooks or single visualizations through signed, JWT-secured URLs and offers an Embed SDK for React. Sigma Tenants let admins provision customer organizations through APIs and swap data sources per tenant. Row-level security, column-level security and role-based access control govern what each user sees, and themes and localization match your brand and markets.
Pricing
Sigma does not publish embedded pricing, and quotes come through sales.
Best For
Sigma suits SaaS teams that already run Snowflake, Databricks or BigQuery and want customers to explore warehouse data in a spreadsheet-style interface.
Trade-offs
Every customer query runs on your warehouse, so compute costs grow with adoption. NoSQL sources need ETL into a warehouse first.
12. Metabase
Metabase is an open-source BI tool with paid embedding features, used by more than 100,000 companies.
Key Capabilities
Metabase offers modular embedding with guest authentication on every plan, including open source, for view-only charts and dashboards. SSO-based embedding adds the query builder, drill-through and AI chat and requires Pro or Enterprise, and a React SDK gives more layout control. Row-level and column-level security for multi-tenant data segregation start on Pro.
Pricing
Metabase publishes its prices. Pro costs $575 per month for 10 users plus $12 per additional user, and users who sign in to embedded analytics through your product count as billable users. Enterprise starts at $20,000 per year, and the open-source edition is free.
Best For
Metabase suits startups and small SaaS teams that want embedded dashboards on a published budget.
Trade-offs
Per-user pricing on Pro rises as signed-in embedded users grow, so products with many end customers need a custom package.
13. Yellowfin
Yellowfin is a BI and embedded analytics platform known for data storytelling and automated insights.
Key Capabilities
Yellowfin embeds dashboards, reports and Stories through a JavaScript scriptlet or iframes and offers extensive white-labeling. Stories add narrative context to charts, and Signals monitors data automatically. Embedded content inherits Yellowfin data security and user preferences by default.
Pricing
Yellowfin does not publish prices. Software vendors can choose an aligned utility model priced by how they sell, a revenue share on an analytics add-on or a fixed server-core model.
Best For
Yellowfin suits software vendors that want analytics pricing tied to their own go-to-market model.
Trade-offs
Prices come only through a quote form, which slows early comparisons. Public pages give few details on multi-tenant setup.
14. Holistics
Holistics is an analytics-as-code BI platform with embedded analytics for customer-facing dashboards.
Key Capabilities
Data teams define datasets, metrics and relationships in a SQL-based modeling language stored in Git, which brings code review and CI/CD to dashboards. Holistics AI turns natural-language questions into AQL queries that reuse existing metric definitions, and AQL compiles into SQL. Embedded dashboards run in an iframe, with row-level and column-level access managed dynamically through APIs and full styling control.
Pricing
Holistics publishes BI plan prices: Entry costs $800 per month on yearly billing for 100 reports and 10 users, and the Security Compliance Suite costs $2,000 per month. Embedded analytics is priced on request and includes unlimited dashboard viewers.
Best For
Holistics suits data teams that want governed, version-controlled metrics behind customer dashboards.
Trade-offs
Code-first modeling suits engineers more than business users. Embedded pricing is not published.
15. Reveal
Reveal, from Infragistics, is an embedded analytics SDK built for software teams.
Key Capabilities
Reveal embeds natively with no iframes, through client SDKs for React, Angular, Vue and Blazor and server SDKs for .NET, Java and Node. It supports cloud, private cloud and self-hosted deployment, including air-gapped setups. User roles pass through JWTs to enforce your access policies, and Reveal AI adds natural-language Q&A, KPI summaries and anomaly detection with per-tenant usage caps.
Pricing
Reveal uses flat-rate pricing with unlimited users and no extra embed fees for additional customers. White-labeling and AI features are included, and quotes come on request after a 30-day SDK trial.
Best For
Reveal suits .NET and JavaScript product teams that want native embedding and self-hosting options.
Trade-offs
Reveal is an SDK, so your developers build and maintain the dashboard experience. Its public pages say less about multi-tenant patterns than workspace-based platforms do.
How to Choose the Right Embedded Analytics Tool for Your SaaS
Choose by matching each tool to your team, your total cost and your security requirements. Four checks narrow the list.
Decide Whether to Build or Buy
The build-or-buy decision depends on your product requirements, your architecture and the engineering capacity you have. Building in-house makes sense when analytics is the product itself, and it can also pay off when you need control over data models, UI or deployment that vendor tools cannot match. Buying makes sense when your team would otherwise spend months maintaining tenant security, caching and chart components.
Review Total Cost Over Three Years
Subscription fees are only part of the cost. Add implementation, training, API usage and warehouse compute, since warehouse-native tools run every dashboard load against your database. Compare three-year totals for your expected tenant and user growth.
Test Tenant Isolation With Real Data
Run cross-tenant tests in a proof of concept built on your own data model. Confirm that every query type your product supports returns nothing when a tenant A token requests tenant B data.
Estimate Engineering Time
Estimate engineering time per tool and per embedding method. Iframe embeds can go live in days, SDK integrations need more front-end work, and tenant provisioning, authentication and theming add time on any platform.
Why Metric Logic Decides Whether Customers Trust Embedded Dashboards
Customers trust embedded dashboards when every number follows one definition and every viewer sees the right slice. Picking a vendor solves rendering. Defining one calculation per metric and one access rule per user group is the product work that decides whether people rely on what they see.
Audi of America faced that problem with sales planning data spread over Excel files, a SQL Server database and SAP BusinessObjects reports. Teams handled more than 45 manual ad hoc reporting requests each month. Darwin built a centralized dashboard system with five modules, including dealer rankings, custom reports and a vehicle pipeline view, on top of daily data cleaning and defined calculation logic for every metric. The system covers 250+ dealerships, 15+ carlines and 49 states and territories, and reports that took hours now reach planning teams in minutes.
The same discipline applies when the viewers are your customers. Settle metric definitions, tenant rules and data connections first, and the embedded analytics tool becomes the easiest part of the project to change later.
FAQs
Q1. Which embedded analytics tool is best for a SaaS product?
No single tool wins for every product. Luzmo, Embeddable, Qrvey and Reveal suit native-feeling customer dashboards. Power BI Embedded, Looker and Tableau suit teams already in those ecosystems. Metabase suits small teams that want published prices.
Q2. What is the difference between embedded analytics and internal BI?
Embedded analytics shows dashboards to your customers inside your product, under your brand and login. Internal BI serves your own team in a separate tool. Embedded use adds tenant isolation, unpredictable concurrency and white-labeling requirements.
Q3. Is iframe or SDK embedding better for a SaaS product?
SDK and web component embedding fit products that need dashboards to match their UI and respond to app events. Iframes fit fast launches and simple views. Check third-party cookie handling, because Safari blocks those cookies by default.
Q4. How do embedded analytics tools keep customer data separate?
Many tools apply row-level security based on identity tokens your app passes with each request. Others isolate tenants in workspaces, orgs or separate schemas. Test isolation with cross-tenant queries on your real data model.
Q5. How much does embedded analytics cost?
Public prices are rare. Luzmo starts at €1,995 per month billed annually, and Metabase Pro costs $575 per month for 10 users. Embeddable, Qrvey, Sisense, Looker, Domo and Sigma price through sales, so compare three-year quotes.