Quick Answer:
To speed up a Tableau dashboard, run a Performance Recording to find the slow step, then trim the data source, consider extracts where scheduled refreshes are enough, apply filters early, simplify calculations, cut the number of views, set a fixed size and move detail behind actions.
TL;DR
- Record first: Tableau’s Performance Recording shows whether load time goes to queries, calculations or rendering.
- Smaller data sources usually load faster, so hide unused fields, aggregate to the grain the dashboard shows and filter at the extract or data source level.
- Each worksheet and each quick filter runs its own query, so fewer views and fewer filters mean fewer queries.
- Fixed-size dashboards are more likely to use a cached version on the server.
- Action filters and show/hide containers can lighten the first screen, and a Performance Recording confirms whether they do.
- Tableau retired View Acceleration in June 2026, so speed gains now come from the workbook and the data source.
A Tableau dashboard that stalls on open loses its audience before anyone clicks the first filter. A Tableau blog post on dashboard speed makes the point this way: “In a world where two-second response times can lose an audience, performance is crucial.” The same expectation applies to weekly sales reviews and executive readouts built on Tableau.
Slow load times usually build up from several sources at once: wide data sources, stacked filters, nested calculations and dashboards that try to answer every question on one screen. Tableau’s guide to optimizing workbooks names the main cause directly: “The majority of slow dashboards are caused by poor design.” When the numbers on a dashboard also look wrong, the problem sits deeper, and these signs of broken marketing data help locate it.
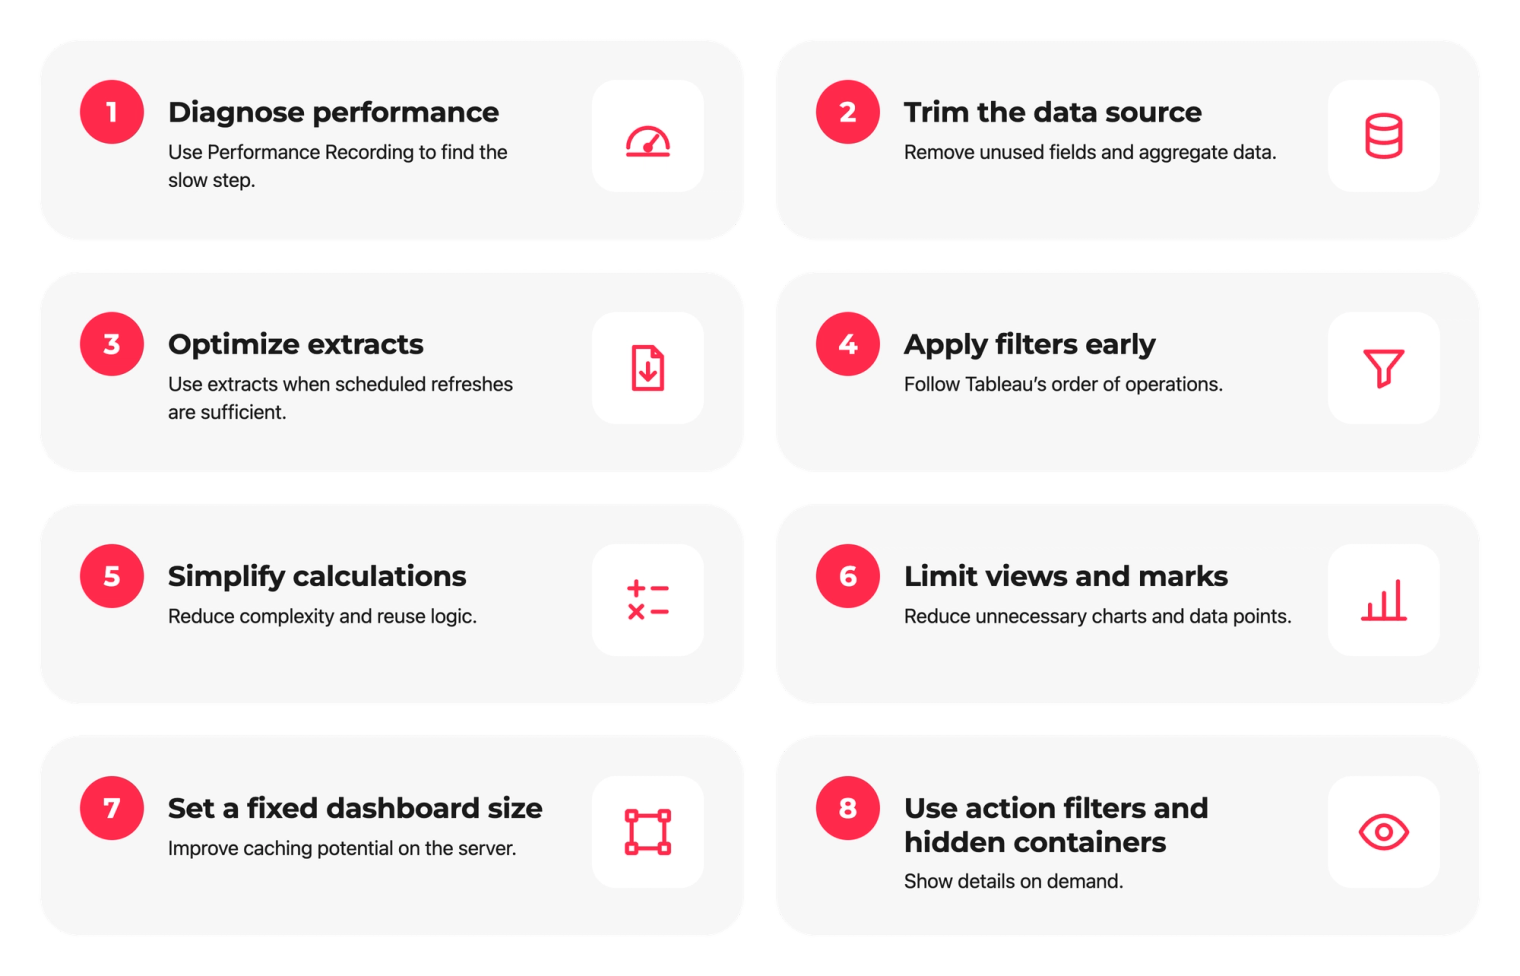
This guide covers eight fixes in the order a Tableau developer would apply them, starting with diagnosis and ending with interaction design. Each section explains what to change and where to find the setting. The 2026 update also reflects one platform change: Tableau retired View Acceleration in Tableau Cloud in June 2026 and in Tableau Server 2026.2, so the gains now come from the workbook itself.
Why a Slow Dashboard Starts in the Data Pipeline
A slow dashboard is often the visible end of a data pipeline problem, which is why Darwin reviews it through the four pillars of the Darwin Flux framework. Surface is the dashboard itself: the views, marks and layout a viewer waits for. Connections cover the data sources, joins and the choice between live connections and extracts. Clarity means one agreed definition for each calculated field, so the same logic is not rebuilt in five different sheets. Momentum is what a fast dashboard gives back to the business: reviews that stay on schedule and decisions that do not wait for a loading spinner.
The eight fixes below map to these pillars. Fixes 1 through 4 work on Connections, fix 5 on Clarity and fixes 6 through 8 on Surface. Momentum is the result to measure after each round of changes.
1. Diagnose the Slow Step With Performance Recording
Start every tuning session with a Performance Recording, because it shows which step consumes the load time. In Tableau Desktop, open Help > Settings and Performance > Start Performance Recording, use the dashboard as a viewer would and stop the recording from the same menu. Tableau then opens a separate workbook that breaks the session into events such as query execution, layout computation and rendering.
Tableau recommends this as the first step and groups the usual causes into four types: long-running queries, a large number of queries, slow calculations and heavy rendering. Each type needs a different fix, and the recording shows which one to start with.
“The saying, if you can’t monitor it, you can’t manage it, can’t ring true enough regarding dashboard speed.” – Francis Dejonckheere, Senior Principal Success Manager, Tableau, in How to Improve Dashboard Load Times with People and Processes
Run the Workbook Optimizer on Every Publish
The Workbook Optimizer checks a workbook against Tableau’s best-practice guidelines and lists what to fix. Open it from Server > Run Optimizer in Tableau Desktop or from the publishing dialog. Results land in three groups: Take action for changes with little or no effect on functionality, Needs review for changes that require restructuring and Passed for guidelines the workbook already meets.
Running the optimizer on each publish helps keep long calculations, unused fields and excess filters from piling up between releases.
Test With Production-Sized Data on Real Devices
Test against data at production scale, since a recording made on a laptop with a sample file shows only part of the picture. After that, open the published dashboard in Tableau Server or Tableau Cloud on the screens your audience uses, including tablets and phones. Device Preview in the Dashboard pane shows how each layout renders on desktop, tablet and phone.
2. Trim the Data Source to What the Dashboard Uses
Trimming the data source is often one of the quickest gains, because Tableau has fewer rows and columns to query and store. Tableau’s own advice is to “Only connect to the data that you need for analysis.”
Hide Unused Fields
Hidden fields drop out of extracts at the next refresh. Right-click a field in the Data pane and choose Hide, or select Hide All Unused Fields in the Extract Data dialog. Width matters here: the same Tableau blog post notes that an extract is a columnar store, so the wider the data set, the slower the query time.
Aggregate to the Grain the Dashboard Shows
Aggregate data to the level the views display. A dashboard that charts monthly revenue does not need daily transaction rows. Use the Aggregate data for visible dimensions option in the Extract Data dialog, or pre-aggregate in the database, in Tableau Prep or in the data integration tool that feeds the warehouse.
Use Numbers and Booleans for Keys and Flags
Tableau’s help states that “Strings and dates are slow, numbers and Booleans are fast.” Convert string IDs to integers in the source and replace text flags such as “Yes” and “No” with Boolean fields.
3. Use Extracts Where Scheduled Refreshes Are Enough
Consider an extract when the dashboard can work with data refreshed on a schedule. A live connection sends queries to the database as users interact, so dashboard speed depends on that database. An extract stores a snapshot in Tableau’s Hyper format, which is built for fast aggregation. Tableau’s help calls extracts “a quick and easy way to make most workbooks run faster.” Darwin’s comparison of Tableau live connections and extracts covers the trade-off in more detail.
Keep a live connection when users need data that changes within minutes, such as support queues or stock levels. In that case, the speed work moves to the data warehouse: index the columns that dashboards filter and join on, and build summary tables for heavy aggregations.
Schedule extract refreshes outside working hours and use incremental refresh for large tables that only receive new rows. Both keep refresh windows short and dashboards available during the day.
4. Apply Filters Early in Tableau’s Order of Operations
Filter as early in Tableau’s order of operations as the use case allows, because early filters shrink the data that later steps process. Tableau applies filters in this sequence:
- Extract filters
- Data source filters
- Context filters
- Dimension filters
- Measure filters
Extract filters remove rows when the extract is built. Data source filters limit what reaches the workbook on live connections and extracts alike, and they suit published data sources scoped to one region or business unit.
Use Context Filters Only When They Cut the Data Sharply
A context filter creates a smaller working set for the filters that follow it, so it pays off only when the cut is large. Tableau’s guidance on context filters says “using a single context filter that significantly reduces the size of the data set is much better” than stacking several. Use them for Top N filters and for dependent filters that need a fixed scope.
Avoid Quick Filters on High-Cardinality Fields
Fields with thousands of unique values, such as customer IDs or order numbers, make slow quick filters because Tableau has to fetch every value to build the list. Tableau’s visualization guidance confirms that “each filter in the view requires a query in order to populate the options.” Switch these filters to Wildcard Match mode or replace them with an action filter from a summary view.
“The best way to fix this potential problem is to remove the drop-down option from the quick filter.” – Robert Curtis, Managing Director APAC, InterWorks, in The Tableau Performance Checklist: Avoid High-Cardinality Quick Filters
Settings such as Only Relevant Values make a filter rebuild its list each time another filter changes, so reserve them for filters that users need to cascade. Include filters are often lighter to run than Exclude filters, which can require the full list of values in the field.
Filter Dates as Continuous Ranges
Continuous date filters, which include relative date and range-of-date filters, can take advantage of database indexing and often run faster than discrete date filters. Relative date filters such as Last 30 Days also keep the dashboard current with no manual edits.
5. Simplify Calculations and Reuse Logic
Move heavy logic into the data source and write the remaining calculations once, because calculated fields run at query time in every view that uses them. Row-level calculations that do not change between refreshes belong in the database or Tableau Prep, where they run once per refresh. For the calculations that stay in the workbook, these habits keep queries lean:
- Use CASE for logic that tests one field against a fixed list of values.
- Write ELSEIF as one word, since ELSE IF opens a new nested IF statement.
- Put the most frequent outcome first, because Tableau stops at the first true condition.
- Build shared logic as one calculated field and reuse it in every sheet that needs it.
- Add FIXED level of detail expressions with care, since each one adds a subquery.
The Workbook Optimizer flags long and nested calculations, which makes it a quick check after each change. Shared definitions also prevent the revenue mismatches covered in Darwin’s month-end reporting playbook.
For a marketing team on GA4, Salesforce and BigQuery, the Cleo case study shows what documented, agreed reporting logic looks like in practice.
6. Limit Views and Marks per Dashboard
Keep each dashboard to the few views that answer its main question, because each worksheet runs one or more queries against the data. Tableau also notes that “more marks means that more processing power and memory is required to render them.” Watch the mark count in the Tableau Desktop status bar and treat a sudden jump as a signal to rethink the view.
A dashboard that needs many views often answers several questions. Split it into separate dashboards linked by navigation buttons, one per question. A KPI dashboard built around decisions keeps the view count low by design.
Choose Chart Types That Render Quickly
Bar and line charts render quickly and show comparisons and trends clearly. Tableau’s documentation singles out large crosstabs and maps with detailed custom polygons as the heavy cases. Remove any dimension from the Detail shelf that the view does not use, since each one adds marks.
Put Detail in Tooltips
Viz in Tooltip shows a small filtered chart on hover, which adds depth and keeps the main view light. Keep tooltip charts simple, since each one runs a query when it appears.
7. Set a Fixed Dashboard Size
Use a fixed size for published dashboards. Tableau’s sizing guidance states that “Published dashboards that use a fixed size can load faster because they’re more likely to use a cached version on the server.” With Automatic sizing, the dashboard resizes to fill each window, which makes a cache match less likely. Pick dimensions that match the main screen your audience uses and confirm the result in a browser.
Add Device Layouts Only for Real Mobile Use
Device layouts for tablets and phones help when people open the dashboard on mobile devices. Each layout adds objects to maintain, so add one when usage data shows mobile traffic and keep phone layouts to the essential views and filters. For phone layouts with many views, the Fit Width setting with vertical scrolling reads better.
8. Move Detail Behind Action Filters and Show/Hide Containers
Show a summary when the dashboard opens and load detail on request. This design can reduce the work on the first screen, and the actual effect depends on the workbook, so measure it with a Performance Recording each time.
Build Guided Analysis With Action Filters
An action filter passes a selection from one sheet to others on a click, a hover or a menu choice. A common pattern pairs a summary chart at the top with a detail table below it. Setting Clearing the selection will to Exclude all values leaves the detail table empty until a user selects a mark, which can mean fewer marks to draw on open. Compare recordings made with and without the action filter to confirm the gain.
Use Show/Hide Containers and Dynamic Zone Visibility
A floating container with Add Show/Hide Button lets users open secondary filters, notes or detail tables when they need them. Dynamic Zone Visibility shows or hides a zone based on a Boolean field or parameter value, which suits dashboards that swap between views. Treat both as layout tools first: a hidden sheet does not always skip its query, so count on a speed gain only when a Performance Recording shows one. Users often miss show/hide buttons, so give each one a clear label.
Quick Reference: Tableau Speed Fixes Compared
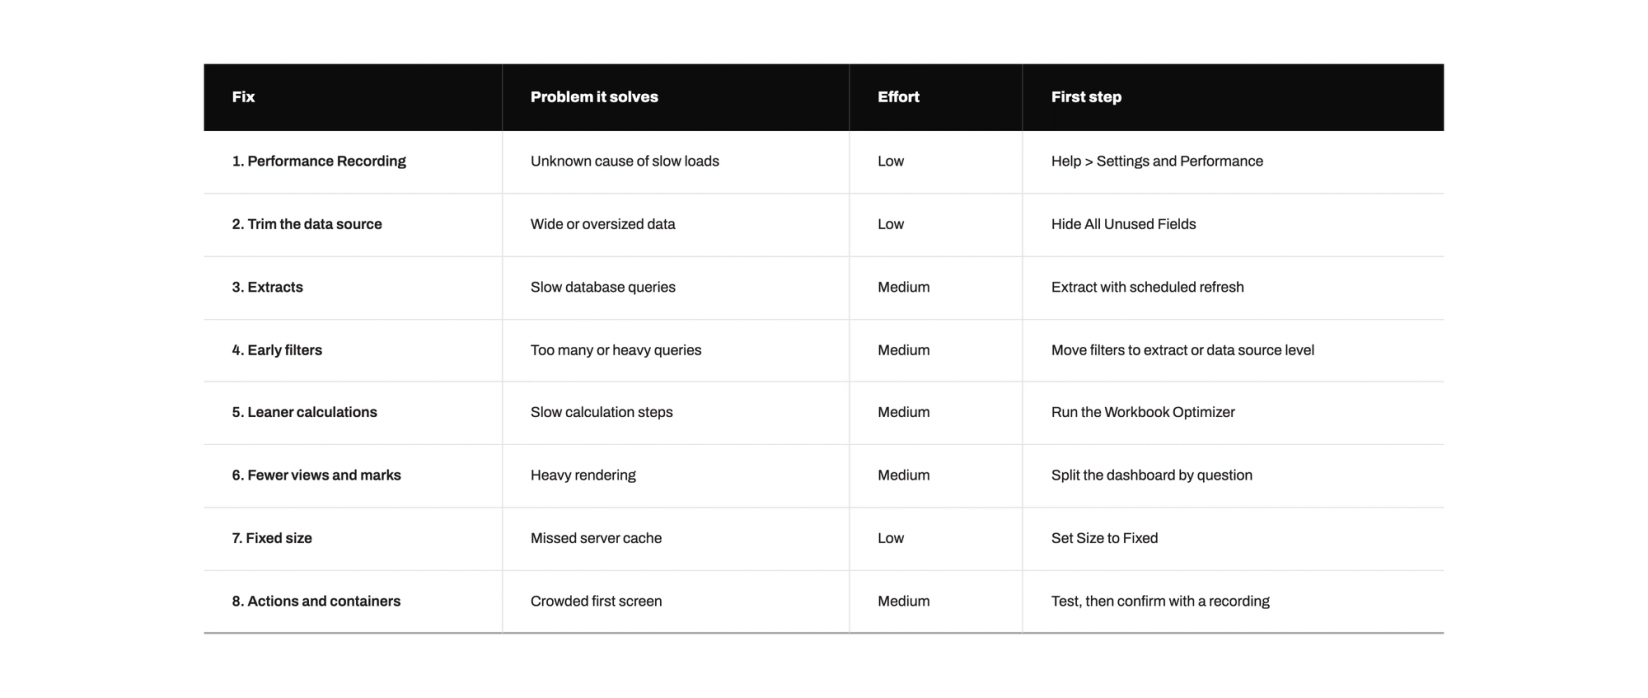
The table compares the eight fixes by the problem each one solves, the effort involved and the first step to take.
How Audi of America Cut Reporting Turnaround to Minutes
Dashboard speed depends on the pipeline behind it, and Darwin’s work with Audi of America shows what that looks like at scale. Audi’s sales planning data sat in Excel spreadsheets, a SQL Server database and SAP BusinessObjects reports. Each reporting cycle required manual assembly, and teams handled more than 35 manual ad hoc reporting requests each month. At that volume, many teams start looking at automated reporting, and Darwin compares the two options in AI-powered reporting and manual dashboards.
Darwin built the reporting foundation on Alteryx and Tableau Prep, with data cleaned and validated daily. The platform now covers more than 250 dealerships, and reporting turnaround shortened to minutes where it previously took hours. The full story is in the Audi of America case study.
The same principle holds for Tableau deployments of any size. Workbook tuning gives quick gains, and lasting speed comes from one clean, validated source that every dashboard shares. That source belongs in a wider data strategy.
FAQs
Q1. Why is my Tableau dashboard so slow?
The usual causes are too many views on one dashboard, wide data sources, quick filters on high-cardinality fields and heavy calculations. A Performance Recording shows which of these consumes the load time, so start there and fix the largest event first.
Q2. Are extracts always faster than live connections in Tableau?
Not always. Extracts often respond faster because Hyper is built for fast aggregation, and a live connection to a well-tuned cloud warehouse can respond just as quickly. Compare both in a Performance Recording with the same dashboard.
Q3. How many views should a Tableau dashboard have?
Tableau sets no fixed limit, but each worksheet runs at least one query. Keep a dashboard focused on one question and split it when the view count grows. A Performance Recording confirms whether the number of queries is the bottleneck.
Q4. Does a fixed dashboard size make Tableau faster?
It can, for published dashboards. Tableau states that fixed-size dashboards can load faster because they are more likely to use a cached version on the server. Automatic sizing adapts to each window, which makes a cache match less likely.
Q5. Is View Acceleration still available in Tableau?
No. Tableau retired View Acceleration in Tableau Cloud in June 2026 and in Tableau Server 2026.2. Speed gains now come from the workbook and the data source: leaner extracts, early filters, simpler calculations and fewer views per dashboard.