
Quick Answer
Data and analytics terminology is the set of standard terms that describe how data is collected, stored, processed and analyzed. Knowing these terms helps business and data teams agree on what a report shows and make decisions on numbers they both trust. This glossary covers 35 terms, and paired concepts such as structured vs. unstructured data count as one entry.
TL;DR
- Shared definitions keep marketing, sales and finance reading the same numbers the same way.
- Descriptive, predictive and prescriptive analytics answer three separate questions: what happened, what will happen and what to do next.
- ETL, data pipelines and data cleansing decide whether a dashboard deserves trust.
- First-party data is valuable when it is collected with clear consent, captured accurately and fit for the decision at hand.
- Newer terms worth knowing include data lakehouse, reverse ETL, semantic layer and data observability.
Data and analytics vocabulary now belongs to every team that reads a dashboard. Marketers, founders and sales leaders make budget calls on numbers they did not build, so knowing what each term means protects each decision.
This guide serves data analysts, business owners and anyone who works with reports. It covers 35 terms in plain English, and paired concepts count as one entry.
How Shared Data Vocabulary Moves a Business Forward
Shared vocabulary turns scattered data into decisions when each term sits in a clear stage of the data journey. We group the terms in this guide by the four pillars of Darwin Flux: Surface, Connections, Clarity and Momentum.
Surface is where data enters the stack, through first-party data, metadata and big data. The Connections pillar links systems through ETL, data pipelines, API integration and reverse ETL. Trustworthy numbers belong to Clarity, which includes data governance, data integrity and the semantic layer. Momentum turns analysis into action through predictive analytics, A/B testing and KPIs.
Why Understanding Data and Analytics Terminology Matters
Clear terminology matters because teams can only act on data they read the same way. When marketing and finance hold different definitions of a "conversion" or an "active customer", one dashboard produces two stories and a stalled meeting. Our month-end revenue reconciliation playbook shows how that gap plays out between CRM, ad and finance numbers.
For business owners, a shared data language closes the gap with analysts and speeds up approvals. Data professionals gain fewer rework cycles and cleaner handoffs when stakeholders use the same terms.
"Data literacy is to the 21st century what literacy was in the past century." – Bernard Marr, Founder and CEO, Bernard Marr & Co.
The sections below cover 30 terms in six groups, followed by five bonus terms from the modern data stack.
1. The Basics of Data and Analytics
The basic terms describe what data is, how it is stored and how teams find patterns in it.
Data
Data is raw information collected from sources such as websites, CRMs, apps and surveys. Numbers, text, images and event logs all count as data, and every analytics process starts with it.
Big Data
Big data refers to datasets too large, fast or varied for standard databases and spreadsheets to process. Gartner defines big data by three traits: volume (scale), variety (formats) and velocity (speed of generation). Some frameworks add veracity as a fourth V for data accuracy.
Structured vs. Unstructured Data
Structured data follows a fixed format of rows and columns, as in databases and spreadsheets. Unstructured data has no predefined format, as in emails, call recordings and social media posts. Semi-structured data, such as JSON files, sits between the two.
Data Mining
Data mining is the process of finding patterns and relationships in large datasets. A retailer might mine purchase history to learn which products customers buy together.
Data Warehousing
A data warehouse is a central repository that stores structured data from many systems for reporting and analysis. Cloud warehouses such as Snowflake, Google BigQuery and Amazon Redshift are common choices for new deployments.
2. Key Analytics Concepts
Analytics concepts describe the questions a team asks of its data and how it measures progress toward goals.
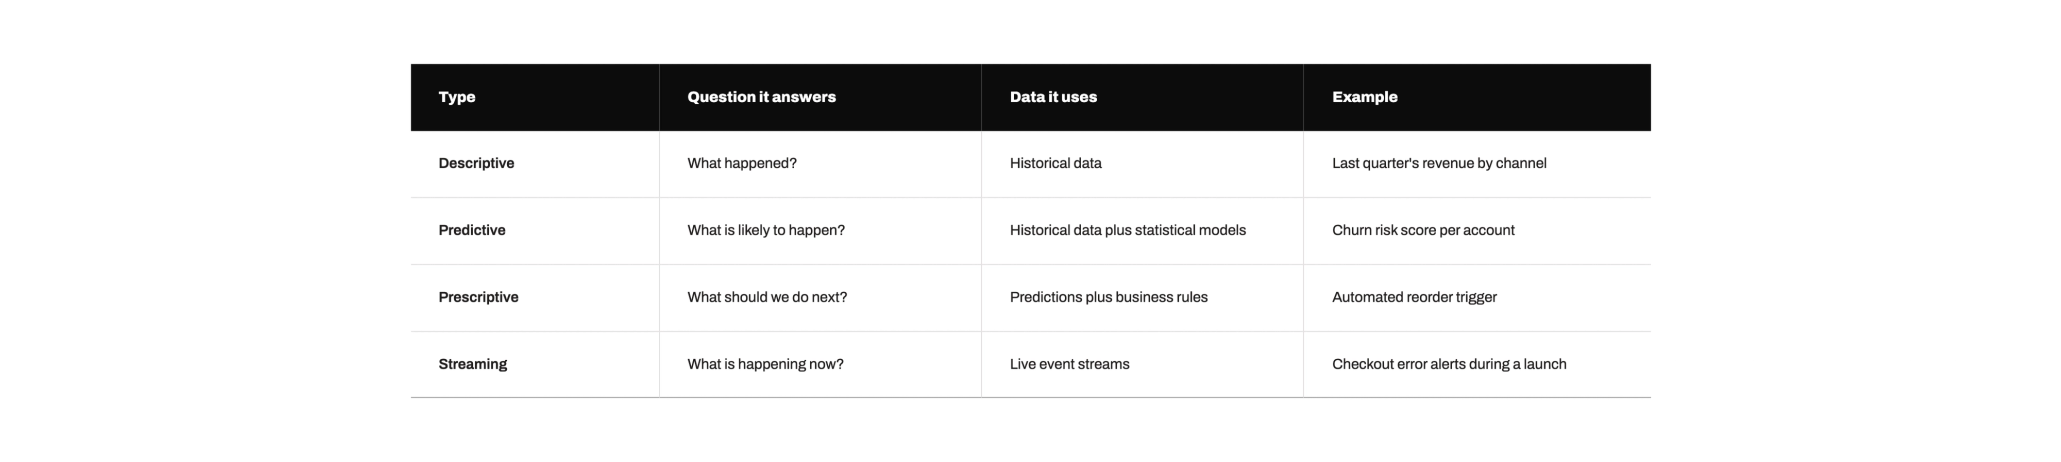
Descriptive Analytics
Descriptive analytics explains what already happened by summarizing past data. Example: "How did sales change last quarter?"
Predictive Analytics
Predictive analytics uses historical data, statistics and machine learning to estimate future outcomes. Example: flagging customers likely to churn based on declining product usage.
Prescriptive Analytics
Prescriptive analytics recommends an action based on data and set business rules. Example: "Stock of Product X will run out in six days, so reorder by Friday."
Streaming Analytics
Streaming analytics processes data the moment it arrives, so teams see events as they happen. Example: monitoring checkout errors on a website during a product launch.
KPI (Key Performance Indicator)
A KPI is a metric tied directly to a business objective. Website conversion rate, customer acquisition cost and monthly recurring revenue are common KPIs for B2B companies.
"Essentially, data literacy is having comfort and confidence to utilize data to help you make smarter, more intelligent decisions." – Jordan Morrow, Author, Be Data Literate
3. Data Processing and Management
Data processing and management terms cover how data moves between systems and how teams keep it accurate.
ETL (Extract, Transform, Load)
ETL is the process of extracting data from source systems, cleaning and restructuring it, then loading it into a data warehouse. Many modern stacks use ELT, which loads raw data first and restructures it inside the warehouse.
Data Governance
Data governance is the set of policies, roles and standards that define who owns data, who can access it and how it complies with regulations such as GDPR. Our guide to data governance roles and responsibilities explains who does what.
Data Integrity
Data integrity means data stays accurate, consistent and complete throughout its lifecycle. Weak integrity erodes trust in the reports built on top of it.
Data Cleansing
Data cleansing removes errors, duplicates and inconsistencies from datasets. Common tasks include merging duplicate CRM contacts, fixing date formats and filling missing fields.
Data Pipeline
A data pipeline is an automated sequence of steps that moves data out of its source into storage and analysis. Think of it as the plumbing of the data world: when a pipe leaks, the dashboards downstream show the wrong numbers. Darwin builds these pipes as part of its integrations and automations work.
4. Types of Data and Metrics
These terms describe where data comes from and which metrics businesses track most often.
Quantitative vs. Qualitative Data
Quantitative data is measurable, such as revenue or website sessions. Qualitative data is descriptive, such as customer interview notes or open-ended survey answers. Strong analysis combines both, since numbers show what changed and qualitative input explains why.
Metadata
Metadata is data about data. The author, creation date and file size of a document are metadata, and so are the column definitions in a database table.
First-Party, Second-Party and Third-Party Data
These three terms describe who collects the data. First-party data is what you collect directly from customers, such as transactions and form fills. Second-party data is another company's first-party data shared with you through a partnership. Third-party data is collected by external providers and sold to businesses. First-party data is most useful when customers gave clear consent, collection is accurate and the fields match the decisions a team needs to make.
Churn Rate
Churn rate is the percentage of customers who stop using a product or service during a set period. A SaaS company that starts a month with 200 customers and loses 6 has a monthly churn rate of 3%.
Conversion Rate
Conversion rate is the percentage of users who complete a desired action, such as a purchase or a demo request. In GA4, marketers mark these actions as key events.
5. Data Analytics Tools and Techniques
These tools and techniques are what analysts use daily to query, test and present data.
SQL (Structured Query Language)
SQL is the standard language for querying and managing relational databases. It remains a baseline skill for analysts, and many BI tools generate SQL in the background.
Machine Learning
Machine learning is a branch of artificial intelligence in which systems learn patterns from data and use them to make predictions. Lead scoring, product recommendations and demand forecasts all rely on it.
A/B Testing
A/B testing compares two versions of a page, email or ad to find which one drives more of a target action. When users are randomly assigned, the test runs long enough and the sample is large enough, the result supports a causal conclusion about the change.
Data Visualization
Data visualization presents data as charts, graphs and dashboards so patterns are easy to spot. Looker Studio, Tableau and Power BI are widely used tools.
Regression Analysis
Regression analysis is a statistical method that estimates the relationship between variables. Example: modeling how monthly sales move with ad spend. The result shows an association, and confirming that extra spend caused extra sales calls for a controlled experiment or incrementality test.
6. Emerging Trends in Data and Analytics
The emerging trends below shape how companies store, analyze and protect data in 2026.
AI-Assisted Analytics
AI-assisted analytics uses machine learning and large language models to automate data preparation, flag anomalies and answer questions in plain language. In Power BI, for example, Copilot answers natural-language questions by querying the semantic model and returning a visual. The answers are only as good as the inputs, which is why marketing data readiness for AI comes first.
Cloud Data Storage
Cloud data storage keeps data on provider infrastructure such as AWS, Google Cloud and Microsoft Azure. Teams pay for the capacity they use and scale storage up or down on demand.
Privacy and Compliance
Privacy and compliance rules govern how companies collect and use personal data. Under GDPR, people in the EU have rights to access, correct and erase their personal data, and organizations need a legal basis, such as consent, to process it. The CCPA, as amended by the CPRA, gives California residents rights to know, delete, correct and opt out of the sale or sharing of their personal information.
The EU AI Act sets risk-based rules for AI developers and deployers tied to specific uses of AI, so its obligations depend on the use case and risk level. Darwin covers the website side of these rules through its security and compliance services.
Edge Analytics
Edge analytics processes data near its source, on devices or local servers, which cuts latency and bandwidth costs. Manufacturing sensors and retail cameras are common use cases.
Data Observability
Data observability is the practice of monitoring the health of data pipelines. Monte Carlo breaks it into five pillars: freshness, distribution, volume, schema and lineage. It alerts teams when data breaks, so a broken report is caught early. Our comparison of data quality monitoring tools shows how teams set this up.
Bonus: Modern Data Stack Terms to Know
These five terms complete the list of 35 and describe how current data stacks are built.
Data Lake
A data lake stores large volumes of raw data in its original format, structured or unstructured, at low cost. Data scientists use lakes for exploration and machine learning.
Data Lakehouse
A data lakehouse combines the low-cost storage of a data lake with the management and query features of a warehouse. Databricks describes the lakehouse as a single system for BI and machine learning workloads that helps establish one source of truth.
Reverse ETL
Reverse ETL sends modeled data out of the warehouse into business tools such as CRMs, ad platforms and email software. Sales and marketing teams then act on the same data analysts use. See our review of reverse ETL tools for current options.
Semantic Layer
A semantic layer is a shared set of metric definitions that sits between the warehouse and BI tools. It ensures "revenue" or "active user" returns the same number in every dashboard.
API Integration
API integration connects software systems through application programming interfaces so they exchange data automatically. It links a CRM, an analytics platform and ad accounts with no manual exports, a topic our guide to marketing data integration tools covers in depth.
Analytics Types Compared
The four analytics types differ by the question they answer and the data they need.
Why Clear Definitions Make Reporting Trustworthy
Terminology problems show up in reports long before anyone notices them in conversation. A "lead" in the CRM, a "key event" in GA4 and a "conversion" in the ad platform can describe three different things, and leadership sees three numbers for one question.
Darwin saw this pattern with Cleo. Darwin connected GA4, Salesforce and BigQuery into Looker Studio and agreed shared definitions for pipeline, ROI and CAC, with a named owner for each metric. Reporting accuracy improved to roughly 90%, up from about 70%. The team recovered two full working days each month, and Cleo removed $50K in annual third-party attribution spend.
A glossary is the starting point, and the value comes when each term has one definition, one owner and one source of truth inside the stack. Darwin's Data & Analytics team builds that foundation: connected sources, agreed metric definitions and reporting that holds up in leadership reviews.
FAQs
Q1. What is the difference between data and analytics?
Data is the raw information a business collects, such as transactions, events and survey answers. Analytics is the process of examining that data to find patterns, explain results and guide decisions. Data is the input, and analytics produces the insight.
Q2. What is the difference between a data warehouse and a data lake?
A data warehouse stores cleaned, structured data ready for reporting. A data lake stores raw data in any format at lower cost, mainly for exploration and machine learning. A lakehouse combines both. Our guide to choosing a customer data stack compares the options.
Q3. Which data and analytics terms should marketers learn first?
Marketers get the fastest return from conversion rate, KPI, first-party data, A/B testing and churn rate. These terms appear in daily reporting and budget discussions, and they connect campaign activity to revenue outcomes.
Q4. What does ETL mean in data analytics?
ETL stands for extract, transform, load. Data is pulled from source systems, cleaned and restructured, then loaded into a warehouse for analysis. ELT is a newer variant that loads raw data first and processes it inside the warehouse.
Q5. Why does data governance matter for small companies?
Small companies add tools quickly, and each tool creates its own version of customer and revenue data. Basic governance assigns owners, defines key metrics and controls access, which keeps reports reliable as the company grows.